flow_duration_curve
- postprocessinglib.evaluation.visuals.flow_duration_curve(merged_df: DataFrame = None, sim_df: DataFrame = None, df: DataFrame = None, legend: tuple[str, str] = ('Data',), grid: bool = False, minor_grid: bool = False, title: str = None, labels: tuple[str, str] = ('Exceedance Probability (%)', 'Flow'), linestyles: tuple[str, str] = ('r-',), linewidth: tuple[float, float] = (1.5,), fig_size: tuple[float, float] = (10, 6), font_size: int = 12, save: bool = False, save_as: str = None, dir: str = '/home/docs/checkouts/readthedocs.org/user_builds/nhs-postprocessing/checkouts/stable/docs/source') figure
Generate a Flow Duration Curve (FDC) comparing observed and simulated streamflow.
A Flow Duration Curve (FDC) is a graphical representation of the percentage of time that streamflow is equal to or exceeds a particular value over a given period. It provides insights into the variability and availability of water in a river system, capturing both high and low flow conditions. This function calculates the exceedance probability of observed and simulated streamflow, ranks the values from highest to lowest, and plots them on a probability scale. The function allows for flexible customization of labels, legends, transparency, and line styles. The FDC is a crucial tool in hydrology for assessing water availability, evaluating hydrological model performance, and understanding flow regime characteristics.
- Parameters:
merged_df (pd.DataFrame, optional) – A DataFrame containing both observed and simulated streamflow data. The observed data should be in the even-numbered columns, and the simulated data in the odd-numbered columns.
sim_df (pd.DataFrame, optional) – A DataFrame containing simulated streamflow data. This is used if merged_df is not provided.
legend (tuple of str, optional) – A tuple with two string labels for the legend: the first for the simulated data and the second for the observed data. Defaults to (‘Simulated Data’, ‘Observed Data’).
grid (bool, optional) – Whether to display a grid on the plot. Defaults to False.
minor_grid (bool, optional) – Whether to display a minor grid on the plot. Defaults to False.
title (str, optional) – Title of the plot. If not provided, no title will be displayed.
labels (tuple of str, optional) – A tuple with two string labels for the x and y axes. Defaults to (‘Exceedance Probability (%)’, ‘Flow (m³/s)’).
linestyles (tuple of str, optional) – A tuple with two strings specifying the line styles for the simulated and observed data, respectively. Defaults to (‘r-’, ‘b-‘).
linewidth (tuple of float, optional) – A tuple with two floats specifying the line widths for the simulated and observed data, respectively. Defaults to (1.5, 1.25).
fig_size (tuple of float, optional) – A tuple with two floats specifying the width and height of the figure in inches. Defaults to (10, 6).
font_size (int, optional) – Font size for the plot text. Defaults to 12.
save (bool, optional) – Whether to save the plot as a file. Defaults to False.
save_as (str, optional) – The file name (with extension) to save the plot as. Only used if save=True.
dir (str, optional) – The directory to save the plot file. Only used if save=True. Defaults to the current working directory.
- Returns:
fig – The Matplotlib figure instance containing the FDC plot.
- Return type:
matplotlib.figure.Figure
- Raises:
RuntimeError – If neither merged_df nor both obs_df and sim_df are provided.
Example
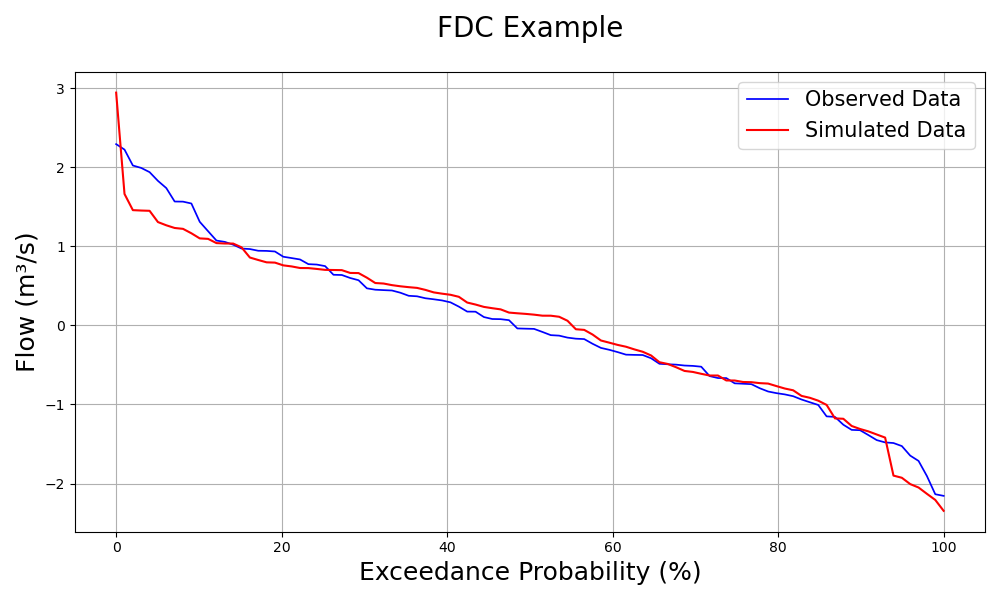
>>> import numpy as np
>>> import pandas as pd
>>> import postprocessinglib.evaluation.visuals as visuals
>>> # Example observed and simulated data
>>> observed = pd.DataFrame(np.random.randn(100, 1), columns=["Flow"])
>>> simulated = pd.DataFrame(np.random.randn(100, 1), columns=["Flow"])
>>> visuals.flow_duration_curve(observed=observed, simulated=simulated, title="FDC Example", grid =True)
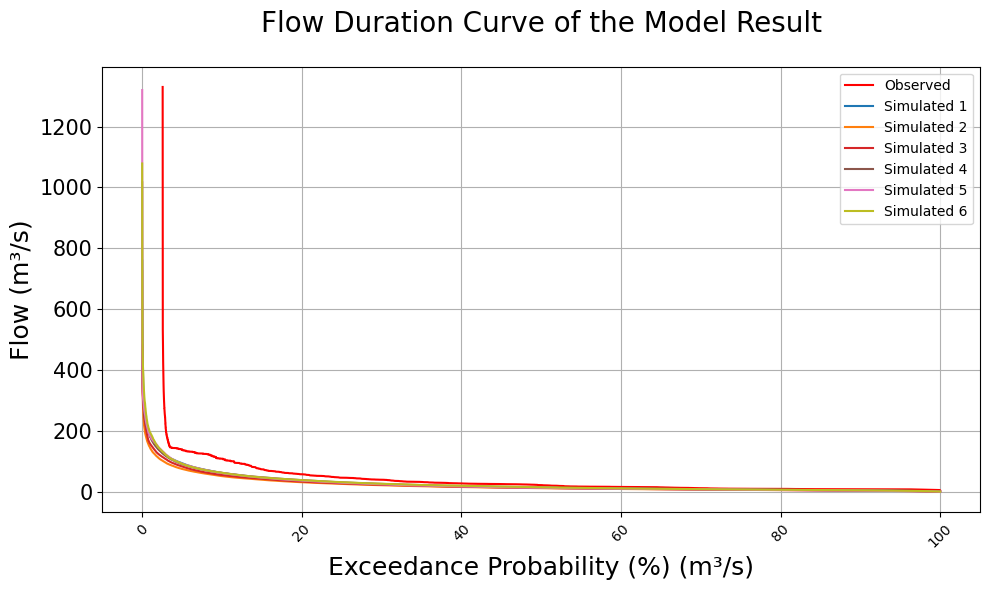
>>> # Example merged dataframe
>>> merged_df = pd.concat([observed, simulated], axis=1)
>>> visuals.flow_duration_curve(merged_df = merged_df, title="Flow Duration Curve of the Model Result", grid =True)