Single Model Analysis
This example demonstrates a full extensive use of the library to carry out analysis of a single model prediction run. It contains tutorials right from reading the data in, in the correct format, diagonistic metric calculations, all the way down to visualizations.
It is intended to be a step through guide that you can follow, cell by cell to achieve your desired model diagonistics output.
As usual, ensure you have done through all the steps as described in the Quick Start section of the documentation page.
Similarly, if you would like to open an editable runnable version of the tutorial click here to be directed to a binder platform
[1]:
# Import necessary modules and the postprocessing library

import pandas as pd
import numpy as np
import glob
from natsort import natsorted


from postprocessinglib.evaluation import data, metrics, visuals
from postprocessinglib.utilities import _helper_functions as hlp
[2]:
# Define the input paths and organize them

folder = r'C:\Users\udenzeU\OneDrive - EC-EC\Fuad_Mesh_Dataset\C0_SRB_Runs' ## new line
start_dates = pd.to_datetime('2006-01-01')
end_dates = pd.to_datetime('2016-12-31')

# Extract the single CSV file
csv_3 = glob.glob(f"{folder}/tr3orgs_out2_20250722_131357/MESH_output_streamflow.csv")

# Path to station names that we will use later.
station_input = "Stations36_updated.xlsx"
Using just the csv file from the third “model run” …
we use the generate_dataframes() function to extract the data in a format to be used by the rest of the library
[3]:
# Load the Streamflow data using the `generate_dataframes` function

DATAFRAMES = data.generate_dataframes(csv_fpaths=csv_3, start_date = start_dates)
The start date for the Data is 2006-01-01
[4]:
for key, value in DATAFRAMES.items():
    print(f"{key}:\n{value.head}")
DF:
<bound method NDFrame.head of QOMEAS_05AA024 QOSIM_05AA024 QOMEAS_05AC003 QOSIM_05AC003 \
2006-01-01 16.20 8.251542 1.250 0.934610
2006-01-02 16.20 8.268182 1.260 0.927514
2006-01-03 16.10 8.268285 1.280 0.922706
2006-01-04 16.10 8.265919 1.300 0.919975
2006-01-05 16.10 8.263036 1.350 0.918143
... ... ... ... ...
2016-12-27 8.62 0.655629 0.966 0.528861
2016-12-28 8.64 0.652242 1.010 0.534474
2016-12-29 8.63 0.648954 1.030 0.539484
2016-12-30 8.64 0.645164 1.030 0.543866
2016-12-31 8.61 0.642502 1.010 0.547652
QOMEAS_05AD007 QOSIM_05AD007 QOMEAS_05AG006 QOSIM_05AG006 \
2006-01-01 41.3 18.313040 52.3 19.312690
2006-01-02 41.9 17.737730 53.0 19.291240
2006-01-03 42.1 16.954540 53.3 19.268370
2006-01-04 42.4 16.726120 54.5 19.212070
2006-01-05 43.1 16.695080 54.1 19.003410
... ... ... ... ...
2016-12-27 20.7 7.048034 21.7 7.151505
2016-12-28 22.0 7.042959 22.6 7.145447
2016-12-29 24.5 7.037765 24.3 7.139501
2016-12-30 25.5 7.032383 25.7 7.133636
2016-12-31 25.1 7.026749 25.8 7.127830
QOMEAS_05AJ001 QOSIM_05AJ001 ... QOMEAS_05HD039 QOSIM_05HD039 \
2006-01-01 144.0 77.77477 ... 0.363 0.021097
2006-01-02 147.0 77.72770 ... 0.408 0.020869
2006-01-03 145.0 77.68994 ... 0.504 0.020657
2006-01-04 146.0 77.65980 ... 0.524 0.020458
2006-01-05 147.0 77.61514 ... 0.487 0.020272
... ... ... ... ... ...
2016-12-27 82.6 34.76269 ... 1.650 0.099204
2016-12-28 85.5 34.57685 ... 1.670 0.092179
2016-12-29 86.4 34.38791 ... 1.700 0.085633
2016-12-30 85.6 34.19665 ... 1.700 0.079540
2016-12-31 83.5 34.00348 ... 1.710 0.073904
QOMEAS_05HG001 QOSIM_05HG001 QOMEAS_05KD003 QOSIM_05KD003 \
2006-01-01 245.0 243.9071 317.0 279.7522
2006-01-02 250.0 246.0166 312.0 253.4234
2006-01-03 247.0 263.2702 324.0 287.3772
2006-01-04 251.0 275.0443 372.0 318.6789
2006-01-05 282.0 275.7499 569.0 341.7578
... ... ... ... ...
2016-12-27 294.0 223.4322 301.0 353.2743
2016-12-28 291.0 223.0046 424.0 353.3249
2016-12-29 290.0 222.7246 450.0 353.5526
2016-12-30 291.0 222.7773 413.0 350.5949
2016-12-31 296.0 224.0186 415.0 349.6316
QOMEAS_05KE002 QOSIM_05KE002 QOMEAS_05KJ001 QOSIM_05KJ001
2006-01-01 NaN 6.080291 580.0 458.8904
2006-01-02 NaN 6.043128 577.0 457.1690
2006-01-03 NaN 6.003728 574.0 445.3347
2006-01-04 NaN 5.961734 570.0 390.2301
2006-01-05 NaN 5.921951 565.0 336.3000
... ... ... ... ...
2016-12-27 NaN 0.802104 646.0 382.5126
2016-12-28 NaN 0.799029 628.0 381.3967
2016-12-29 NaN 0.795955 615.0 380.3037
2016-12-30 NaN 0.792732 603.0 379.8543
2016-12-31 NaN 0.789295 597.0 379.1852
[4018 rows x 72 columns]>
DF_OBSERVED:
<bound method NDFrame.head of QOMEAS_05AA024 QOMEAS_05AC003 QOMEAS_05AD007 QOMEAS_05AG006 \
2006-01-01 16.20 1.250 41.3 52.3
2006-01-02 16.20 1.260 41.9 53.0
2006-01-03 16.10 1.280 42.1 53.3
2006-01-04 16.10 1.300 42.4 54.5
2006-01-05 16.10 1.350 43.1 54.1
... ... ... ... ...
2016-12-27 8.62 0.966 20.7 21.7
2016-12-28 8.64 1.010 22.0 22.6
2016-12-29 8.63 1.030 24.5 24.3
2016-12-30 8.64 1.030 25.5 25.7
2016-12-31 8.61 1.010 25.1 25.8
QOMEAS_05AJ001 QOMEAS_05BA001 QOMEAS_05BB001 QOMEAS_05BG010 \
2006-01-01 144.0 NaN 12.7 3.71
2006-01-02 147.0 NaN 12.7 3.66
2006-01-03 145.0 NaN 12.7 3.63
2006-01-04 146.0 NaN 12.8 3.58
2006-01-05 147.0 NaN 12.7 3.55
... ... ... ... ...
2016-12-27 82.6 NaN 11.7 2.88
2016-12-28 85.5 NaN 12.2 2.86
2016-12-29 86.4 NaN 11.8 2.83
2016-12-30 85.6 NaN 11.5 2.82
2016-12-31 83.5 NaN 11.2 2.80
QOMEAS_05BH004 QOMEAS_05BL024 ... QOMEAS_05FA001 \
2006-01-01 64.7 8.30 ... 0.197
2006-01-02 66.2 8.33 ... 0.187
2006-01-03 67.5 8.03 ... 0.182
2006-01-04 69.0 7.42 ... 0.172
2006-01-05 70.4 7.50 ... 0.156
... ... ... ... ...
2016-12-27 36.4 3.69 ... 0.186
2016-12-28 35.8 3.96 ... 0.188
2016-12-29 43.1 4.15 ... 0.190
2016-12-30 42.6 4.27 ... 0.186
2016-12-31 45.0 4.32 ... 0.172
QOMEAS_05FC001 QOMEAS_05FC008 QOMEAS_05FE004 QOMEAS_05GG001 \
2006-01-01 NaN NaN 1.420 154.0
2006-01-02 NaN NaN 1.410 159.0
2006-01-03 NaN NaN 1.420 177.0
2006-01-04 NaN NaN 1.420 207.0
2006-01-05 NaN NaN 1.440 214.0
... ... ... ... ...
2016-12-27 NaN NaN 0.747 191.0
2016-12-28 NaN NaN 0.720 197.0
2016-12-29 NaN NaN 0.694 197.0
2016-12-30 NaN NaN 0.668 189.0
2016-12-31 NaN NaN 0.644 181.0
QOMEAS_05HD039 QOMEAS_05HG001 QOMEAS_05KD003 QOMEAS_05KE002 \
2006-01-01 0.363 245.0 317.0 NaN
2006-01-02 0.408 250.0 312.0 NaN
2006-01-03 0.504 247.0 324.0 NaN
2006-01-04 0.524 251.0 372.0 NaN
2006-01-05 0.487 282.0 569.0 NaN
... ... ... ... ...
2016-12-27 1.650 294.0 301.0 NaN
2016-12-28 1.670 291.0 424.0 NaN
2016-12-29 1.700 290.0 450.0 NaN
2016-12-30 1.700 291.0 413.0 NaN
2016-12-31 1.710 296.0 415.0 NaN
QOMEAS_05KJ001
2006-01-01 580.0
2006-01-02 577.0
2006-01-03 574.0
2006-01-04 570.0
2006-01-05 565.0
... ...
2016-12-27 646.0
2016-12-28 628.0
2016-12-29 615.0
2016-12-30 603.0
2016-12-31 597.0
[4018 rows x 36 columns]>
DF_SIMULATED:
<bound method NDFrame.head of QOSIM_05AA024 QOSIM_05AC003 QOSIM_05AD007 QOSIM_05AG006 \
2006-01-01 8.251542 0.934610 18.313040 19.312690
2006-01-02 8.268182 0.927514 17.737730 19.291240
2006-01-03 8.268285 0.922706 16.954540 19.268370
2006-01-04 8.265919 0.919975 16.726120 19.212070
2006-01-05 8.263036 0.918143 16.695080 19.003410
... ... ... ... ...
2016-12-27 0.655629 0.528861 7.048034 7.151505
2016-12-28 0.652242 0.534474 7.042959 7.145447
2016-12-29 0.648954 0.539484 7.037765 7.139501
2016-12-30 0.645164 0.543866 7.032383 7.133636
2016-12-31 0.642502 0.547652 7.026749 7.127830
QOSIM_05AJ001 QOSIM_05BA001 QOSIM_05BB001 QOSIM_05BG010 \
2006-01-01 77.77477 1.183666 5.252231 0.431461
2006-01-02 77.72770 1.172835 5.207210 0.425622
2006-01-03 77.68994 1.161657 5.161536 0.419869
2006-01-04 77.65980 1.150785 5.116543 0.414203
2006-01-05 77.61514 1.140337 5.070806 0.408606
... ... ... ... ...
2016-12-27 34.76269 1.259803 4.608318 0.279653
2016-12-28 34.57685 1.248078 4.566650 0.277161
2016-12-29 34.38791 1.236539 4.525266 0.274679
2016-12-30 34.19665 1.225125 4.478406 0.272189
2016-12-31 34.00348 1.213826 4.433925 0.269717
QOSIM_05BH004 QOSIM_05BL024 ... QOSIM_05FA001 QOSIM_05FC001 \
2006-01-01 52.85093 1.342807 ... 0.002308 0.027697
2006-01-02 48.89791 1.334097 ... 0.002239 0.026929
2006-01-03 47.83511 1.325669 ... 0.002174 0.026189
2006-01-04 47.67530 1.318301 ... 0.002110 0.025478
2006-01-05 47.65258 1.306869 ... 0.002049 0.024793
... ... ... ... ... ...
2016-12-27 21.76819 0.370559 ... 0.017074 0.064395
2016-12-28 21.25079 0.361210 ... 0.016876 0.062579
2016-12-29 20.95304 0.352394 ... 0.016695 0.060817
2016-12-30 20.67565 0.344078 ... 0.016528 0.059110
2016-12-31 20.40675 0.336003 ... 0.016373 0.057458
QOSIM_05FC008 QOSIM_05FE004 QOSIM_05GG001 QOSIM_05HD039 \
2006-01-01 0.609218 6.532234 131.1006 0.021097
2006-01-02 0.607228 6.504723 130.5874 0.020869
2006-01-03 0.605276 6.477517 130.1418 0.020657
2006-01-04 0.603361 6.450729 129.7527 0.020458
2006-01-05 0.601481 6.424485 129.4009 0.020272
... ... ... ... ...
2016-12-27 0.116672 0.393923 114.1589 0.099204
2016-12-28 0.114247 0.392005 113.7905 0.092179
2016-12-29 0.111877 0.389987 113.4777 0.085633
2016-12-30 0.109558 0.387873 113.2033 0.079540
2016-12-31 0.107288 0.385667 112.9515 0.073904
QOSIM_05HG001 QOSIM_05KD003 QOSIM_05KE002 QOSIM_05KJ001
2006-01-01 243.9071 279.7522 6.080291 458.8904
2006-01-02 246.0166 253.4234 6.043128 457.1690
2006-01-03 263.2702 287.3772 6.003728 445.3347
2006-01-04 275.0443 318.6789 5.961734 390.2301
2006-01-05 275.7499 341.7578 5.921951 336.3000
... ... ... ... ...
2016-12-27 223.4322 353.2743 0.802104 382.5126
2016-12-28 223.0046 353.3249 0.799029 381.3967
2016-12-29 222.7246 353.5526 0.795955 380.3037
2016-12-30 222.7773 350.5949 0.792732 379.8543
2016-12-31 224.0186 349.6316 0.789295 379.1852
[4018 rows x 36 columns]>
DF_MERGED:
<bound method NDFrame.head of Station1 Station2 Station3 Station4 \
QOMEAS QOSIM1 QOMEAS QOSIM1 QOMEAS QOSIM1 QOMEAS
2006-01-01 16.20 8.251542 1.250 0.934610 41.3 18.313040 52.3
2006-01-02 16.20 8.268182 1.260 0.927514 41.9 17.737730 53.0
2006-01-03 16.10 8.268285 1.280 0.922706 42.1 16.954540 53.3
2006-01-04 16.10 8.265919 1.300 0.919975 42.4 16.726120 54.5
2006-01-05 16.10 8.263036 1.350 0.918143 43.1 16.695080 54.1
... ... ... ... ... ... ... ...
2016-12-27 8.62 0.655629 0.966 0.528861 20.7 7.048034 21.7
2016-12-28 8.64 0.652242 1.010 0.534474 22.0 7.042959 22.6
2016-12-29 8.63 0.648954 1.030 0.539484 24.5 7.037765 24.3
2016-12-30 8.64 0.645164 1.030 0.543866 25.5 7.032383 25.7
2016-12-31 8.61 0.642502 1.010 0.547652 25.1 7.026749 25.8
Station5 ... Station32 Station33 \
QOSIM1 QOMEAS QOSIM1 ... QOMEAS QOSIM1 QOMEAS
2006-01-01 19.312690 144.0 77.77477 ... 0.363 0.021097 245.0
2006-01-02 19.291240 147.0 77.72770 ... 0.408 0.020869 250.0
2006-01-03 19.268370 145.0 77.68994 ... 0.504 0.020657 247.0
2006-01-04 19.212070 146.0 77.65980 ... 0.524 0.020458 251.0
2006-01-05 19.003410 147.0 77.61514 ... 0.487 0.020272 282.0
... ... ... ... ... ... ... ...
2016-12-27 7.151505 82.6 34.76269 ... 1.650 0.099204 294.0
2016-12-28 7.145447 85.5 34.57685 ... 1.670 0.092179 291.0
2016-12-29 7.139501 86.4 34.38791 ... 1.700 0.085633 290.0
2016-12-30 7.133636 85.6 34.19665 ... 1.700 0.079540 291.0
2016-12-31 7.127830 83.5 34.00348 ... 1.710 0.073904 296.0
Station34 Station35 Station36 \
QOSIM1 QOMEAS QOSIM1 QOMEAS QOSIM1 QOMEAS
2006-01-01 243.9071 317.0 279.7522 NaN 6.080291 580.0
2006-01-02 246.0166 312.0 253.4234 NaN 6.043128 577.0
2006-01-03 263.2702 324.0 287.3772 NaN 6.003728 574.0
2006-01-04 275.0443 372.0 318.6789 NaN 5.961734 570.0
2006-01-05 275.7499 569.0 341.7578 NaN 5.921951 565.0
... ... ... ... ... ... ...
2016-12-27 223.4322 301.0 353.2743 NaN 0.802104 646.0
2016-12-28 223.0046 424.0 353.3249 NaN 0.799029 628.0
2016-12-29 222.7246 450.0 353.5526 NaN 0.795955 615.0
2016-12-30 222.7773 413.0 350.5949 NaN 0.792732 603.0
2016-12-31 224.0186 415.0 349.6316 NaN 0.789295 597.0
QOSIM1
2006-01-01 458.8904
2006-01-02 457.1690
2006-01-03 445.3347
2006-01-04 390.2301
2006-01-05 336.3000
... ...
2016-12-27 382.5126
2016-12-28 381.3967
2016-12-29 380.3037
2016-12-30 379.8543
2016-12-31 379.1852
[4018 rows x 72 columns]>
Observe that the stations in the dataframe DF_MERGED are labelled as Station1, Station2, etc. This is great for versatility but for this example we will be renaming them to the actual station names. This is shown below
[5]:
# We have an excel file containing the station names we need
Stations = pd.read_excel(io=station_input)
Stations = Stations.set_index('Station Number')

# Get the unique level 1 values (e.g., ['QOMEAS', 'QOSIM3'])
level_1_values = DATAFRAMES["DF_MERGED"].columns.get_level_values(1).unique()

# Repeat the index from other_df to match the column count
new_level_0 = np.repeat(Stations.index, len(level_1_values))

# Rebuild the MultiIndex
DATAFRAMES["DF_MERGED"].columns = pd.MultiIndex.from_arrays([new_level_0, DATAFRAMES["DF_MERGED"].columns.get_level_values(1)])
[6]:
merged_df = DATAFRAMES["DF_MERGED"] #simple rename for easy repeated use
merged_df
[6]:
| Station Number | 05AA024 | 05AC003 | 05AD007 | 05AG006 | 05AJ001 | ... | 05HD039 | 05HG001 | 05KD003 | 05KE002 | 05KJ001 | ||||||||||
|---|---|---|---|---|---|---|---|---|---|---|---|---|---|---|---|---|---|---|---|---|---|
| QOMEAS | QOSIM1 | QOMEAS | QOSIM1 | QOMEAS | QOSIM1 | QOMEAS | QOSIM1 | QOMEAS | QOSIM1 | ... | QOMEAS | QOSIM1 | QOMEAS | QOSIM1 | QOMEAS | QOSIM1 | QOMEAS | QOSIM1 | QOMEAS | QOSIM1 | |
| 2006-01-01 | 16.20 | 8.251542 | 1.250 | 0.934610 | 41.3 | 18.313040 | 52.3 | 19.312690 | 144.0 | 77.77477 | ... | 0.363 | 0.021097 | 245.0 | 243.9071 | 317.0 | 279.7522 | NaN | 6.080291 | 580.0 | 458.8904 |
| 2006-01-02 | 16.20 | 8.268182 | 1.260 | 0.927514 | 41.9 | 17.737730 | 53.0 | 19.291240 | 147.0 | 77.72770 | ... | 0.408 | 0.020869 | 250.0 | 246.0166 | 312.0 | 253.4234 | NaN | 6.043128 | 577.0 | 457.1690 |
| 2006-01-03 | 16.10 | 8.268285 | 1.280 | 0.922706 | 42.1 | 16.954540 | 53.3 | 19.268370 | 145.0 | 77.68994 | ... | 0.504 | 0.020657 | 247.0 | 263.2702 | 324.0 | 287.3772 | NaN | 6.003728 | 574.0 | 445.3347 |
| 2006-01-04 | 16.10 | 8.265919 | 1.300 | 0.919975 | 42.4 | 16.726120 | 54.5 | 19.212070 | 146.0 | 77.65980 | ... | 0.524 | 0.020458 | 251.0 | 275.0443 | 372.0 | 318.6789 | NaN | 5.961734 | 570.0 | 390.2301 |
| 2006-01-05 | 16.10 | 8.263036 | 1.350 | 0.918143 | 43.1 | 16.695080 | 54.1 | 19.003410 | 147.0 | 77.61514 | ... | 0.487 | 0.020272 | 282.0 | 275.7499 | 569.0 | 341.7578 | NaN | 5.921951 | 565.0 | 336.3000 |
| ... | ... | ... | ... | ... | ... | ... | ... | ... | ... | ... | ... | ... | ... | ... | ... | ... | ... | ... | ... | ... | ... |
| 2016-12-27 | 8.62 | 0.655629 | 0.966 | 0.528861 | 20.7 | 7.048034 | 21.7 | 7.151505 | 82.6 | 34.76269 | ... | 1.650 | 0.099204 | 294.0 | 223.4322 | 301.0 | 353.2743 | NaN | 0.802104 | 646.0 | 382.5126 |
| 2016-12-28 | 8.64 | 0.652242 | 1.010 | 0.534474 | 22.0 | 7.042959 | 22.6 | 7.145447 | 85.5 | 34.57685 | ... | 1.670 | 0.092179 | 291.0 | 223.0046 | 424.0 | 353.3249 | NaN | 0.799029 | 628.0 | 381.3967 |
| 2016-12-29 | 8.63 | 0.648954 | 1.030 | 0.539484 | 24.5 | 7.037765 | 24.3 | 7.139501 | 86.4 | 34.38791 | ... | 1.700 | 0.085633 | 290.0 | 222.7246 | 450.0 | 353.5526 | NaN | 0.795955 | 615.0 | 380.3037 |
| 2016-12-30 | 8.64 | 0.645164 | 1.030 | 0.543866 | 25.5 | 7.032383 | 25.7 | 7.133636 | 85.6 | 34.19665 | ... | 1.700 | 0.079540 | 291.0 | 222.7773 | 413.0 | 350.5949 | NaN | 0.792732 | 603.0 | 379.8543 |
| 2016-12-31 | 8.61 | 0.642502 | 1.010 | 0.547652 | 25.1 | 7.026749 | 25.8 | 7.127830 | 83.5 | 34.00348 | ... | 1.710 | 0.073904 | 296.0 | 224.0186 | 415.0 | 349.6316 | NaN | 0.789295 | 597.0 | 379.1852 |
4018 rows × 72 columns
We are ready to continue
DATA MANIPULATION
This section involves a lot of the pre aggregation and manipulation that goes into preparing the data for the rest of the library. These aggregations can be performed daily, weekly, monthly, yearly, seasonally and a different type we cal long term seasonal which aggregates the values of a given DataFrame by applying the specified aggregation method to each day across all years in the provided time period resulting in data that has been aggregated into a single year (1 to
365/366 days).
We are also able to perform statistical calculations latitudinally accross each individual ‘day’ of the data frame
[7]:
data.daily_aggregate(df=merged_df)
[7]:
| Station Number | 05AA024 | 05AC003 | 05AD007 | 05AG006 | 05AJ001 | ... | 05HD039 | 05HG001 | 05KD003 | 05KE002 | 05KJ001 | ||||||||||
|---|---|---|---|---|---|---|---|---|---|---|---|---|---|---|---|---|---|---|---|---|---|
| QOMEAS | QOSIM1 | QOMEAS | QOSIM1 | QOMEAS | QOSIM1 | QOMEAS | QOSIM1 | QOMEAS | QOSIM1 | ... | QOMEAS | QOSIM1 | QOMEAS | QOSIM1 | QOMEAS | QOSIM1 | QOMEAS | QOSIM1 | QOMEAS | QOSIM1 | |
| 2006/001 | 16.20 | 8.251542 | 1.250 | 0.934610 | 41.3 | 18.313040 | 52.3 | 19.312690 | 144.0 | 77.77477 | ... | 0.363 | 0.021097 | 245.0 | 243.9071 | 317.0 | 279.7522 | NaN | 6.080291 | 580.0 | 458.8904 |
| 2006/002 | 16.20 | 8.268182 | 1.260 | 0.927514 | 41.9 | 17.737730 | 53.0 | 19.291240 | 147.0 | 77.72770 | ... | 0.408 | 0.020869 | 250.0 | 246.0166 | 312.0 | 253.4234 | NaN | 6.043128 | 577.0 | 457.1690 |
| 2006/003 | 16.10 | 8.268285 | 1.280 | 0.922706 | 42.1 | 16.954540 | 53.3 | 19.268370 | 145.0 | 77.68994 | ... | 0.504 | 0.020657 | 247.0 | 263.2702 | 324.0 | 287.3772 | NaN | 6.003728 | 574.0 | 445.3347 |
| 2006/004 | 16.10 | 8.265919 | 1.300 | 0.919975 | 42.4 | 16.726120 | 54.5 | 19.212070 | 146.0 | 77.65980 | ... | 0.524 | 0.020458 | 251.0 | 275.0443 | 372.0 | 318.6789 | NaN | 5.961734 | 570.0 | 390.2301 |
| 2006/005 | 16.10 | 8.263036 | 1.350 | 0.918143 | 43.1 | 16.695080 | 54.1 | 19.003410 | 147.0 | 77.61514 | ... | 0.487 | 0.020272 | 282.0 | 275.7499 | 569.0 | 341.7578 | NaN | 5.921951 | 565.0 | 336.3000 |
| ... | ... | ... | ... | ... | ... | ... | ... | ... | ... | ... | ... | ... | ... | ... | ... | ... | ... | ... | ... | ... | ... |
| 2016/362 | 8.62 | 0.655629 | 0.966 | 0.528861 | 20.7 | 7.048034 | 21.7 | 7.151505 | 82.6 | 34.76269 | ... | 1.650 | 0.099204 | 294.0 | 223.4322 | 301.0 | 353.2743 | NaN | 0.802104 | 646.0 | 382.5126 |
| 2016/363 | 8.64 | 0.652242 | 1.010 | 0.534474 | 22.0 | 7.042959 | 22.6 | 7.145447 | 85.5 | 34.57685 | ... | 1.670 | 0.092179 | 291.0 | 223.0046 | 424.0 | 353.3249 | NaN | 0.799029 | 628.0 | 381.3967 |
| 2016/364 | 8.63 | 0.648954 | 1.030 | 0.539484 | 24.5 | 7.037765 | 24.3 | 7.139501 | 86.4 | 34.38791 | ... | 1.700 | 0.085633 | 290.0 | 222.7246 | 450.0 | 353.5526 | NaN | 0.795955 | 615.0 | 380.3037 |
| 2016/365 | 8.64 | 0.645164 | 1.030 | 0.543866 | 25.5 | 7.032383 | 25.7 | 7.133636 | 85.6 | 34.19665 | ... | 1.700 | 0.079540 | 291.0 | 222.7773 | 413.0 | 350.5949 | NaN | 0.792732 | 603.0 | 379.8543 |
| 2016/366 | 8.61 | 0.642502 | 1.010 | 0.547652 | 25.1 | 7.026749 | 25.8 | 7.127830 | 83.5 | 34.00348 | ... | 1.710 | 0.073904 | 296.0 | 224.0186 | 415.0 | 349.6316 | NaN | 0.789295 | 597.0 | 379.1852 |
4018 rows × 72 columns
[8]:
data.weekly_aggregate(df=merged_df) # default method of aggregation is mean
[8]:
| Station Number | 05AA024 | 05AC003 | 05AD007 | 05AG006 | 05AJ001 | ... | 05HD039 | 05HG001 | 05KD003 | 05KE002 | 05KJ001 | ||||||||||
|---|---|---|---|---|---|---|---|---|---|---|---|---|---|---|---|---|---|---|---|---|---|
| QOMEAS | QOSIM1 | QOMEAS | QOSIM1 | QOMEAS | QOSIM1 | QOMEAS | QOSIM1 | QOMEAS | QOSIM1 | ... | QOMEAS | QOSIM1 | QOMEAS | QOSIM1 | QOMEAS | QOSIM1 | QOMEAS | QOSIM1 | QOMEAS | QOSIM1 | |
| 2005-12-26 | 16.200000 | 8.251542 | 1.250000 | 0.934610 | 41.300000 | 18.313040 | 52.300000 | 19.312690 | 144.000000 | 77.774770 | ... | 0.363000 | 0.021097 | 245.000000 | 243.907100 | 317.000000 | 279.752200 | NaN | 6.080291 | 580.000000 | 458.890400 |
| 2006-01-02 | 16.100000 | 8.262388 | 1.337143 | 0.921104 | 41.528571 | 16.876756 | 53.314286 | 18.769256 | 146.285714 | 76.702917 | ... | 0.487429 | 0.020296 | 274.714286 | 267.990529 | 430.428571 | 328.044043 | NaN | 5.922108 | 565.857143 | 384.156400 |
| 2006-01-09 | 16.014286 | 8.241057 | 1.444286 | 0.947502 | 38.014286 | 16.589126 | 51.842857 | 17.561850 | 133.857143 | 69.667514 | ... | 0.782714 | 0.019267 | 315.285714 | 261.916243 | 417.285714 | 400.780671 | NaN | 5.667581 | 549.428571 | 431.079029 |
| 2006-01-16 | 16.042857 | 8.217549 | 1.342857 | 0.988841 | 36.700000 | 16.471334 | 41.728571 | 17.434634 | 113.757143 | 68.823094 | ... | 0.685429 | 0.018574 | 357.142857 | 250.260071 | 475.714286 | 401.813371 | NaN | 5.433820 | 545.285714 | 455.695214 |
| 2006-01-23 | 16.042857 | 8.192814 | 1.464286 | 0.945559 | 44.714286 | 16.354024 | 48.371429 | 17.337234 | 112.271429 | 68.464153 | ... | 0.661000 | 0.018067 | 384.142857 | 243.810886 | 491.285714 | 387.294100 | NaN | 5.156011 | 542.142857 | 443.162157 |
| ... | ... | ... | ... | ... | ... | ... | ... | ... | ... | ... | ... | ... | ... | ... | ... | ... | ... | ... | ... | ... | ... |
| 2016-11-28 | 17.257143 | 1.011848 | 0.780857 | 0.503035 | 73.400000 | 8.960993 | 87.671429 | 14.667721 | 127.571429 | 47.506176 | ... | 3.131429 | 0.127999 | 275.285714 | 198.973514 | 347.714286 | 384.900729 | NaN | 1.149480 | 854.714286 | 430.917814 |
| 2016-12-05 | 8.894286 | 0.744000 | 0.565429 | 0.525047 | 24.714286 | 7.266815 | 28.700000 | 8.568589 | 89.728571 | 42.248934 | ... | 1.677143 | 0.155977 | 210.285714 | 242.395557 | 384.857143 | 330.819671 | NaN | 0.941550 | 766.428571 | 385.307743 |
| 2016-12-12 | 8.048571 | 0.697616 | 0.797857 | 0.505303 | 16.800000 | 7.118774 | 18.214286 | 7.344057 | 78.871429 | 42.202360 | ... | 1.695714 | 0.156704 | 263.285714 | 235.595914 | 312.571429 | 360.243586 | NaN | 0.870161 | 715.285714 | 381.812843 |
| 2016-12-19 | 8.665714 | 0.672746 | 0.981143 | 0.511347 | 23.914286 | 7.073929 | 25.471429 | 7.190119 | 82.357143 | 35.966233 | ... | 2.132857 | 0.133940 | 271.000000 | 228.687014 | 380.142857 | 354.470300 | NaN | 0.823403 | 684.714286 | 385.149100 |
| 2016-12-26 | 8.640000 | 0.650614 | 0.995000 | 0.536246 | 23.116667 | 7.040179 | 23.716667 | 7.142613 | 83.850000 | 34.481950 | ... | 1.680000 | 0.089580 | 292.500000 | 223.465933 | 383.666667 | 352.514050 | NaN | 0.797394 | 625.666667 | 380.842917 |
575 rows × 72 columns
[9]:
data.yearly_aggregate(df=merged_df) # default method of aggregation is mean
[9]:
| Station Number | 05AA024 | 05AC003 | 05AD007 | 05AG006 | 05AJ001 | ... | 05HD039 | 05HG001 | 05KD003 | 05KE002 | 05KJ001 | ||||||||||
|---|---|---|---|---|---|---|---|---|---|---|---|---|---|---|---|---|---|---|---|---|---|
| QOMEAS | QOSIM1 | QOMEAS | QOSIM1 | QOMEAS | QOSIM1 | QOMEAS | QOSIM1 | QOMEAS | QOSIM1 | ... | QOMEAS | QOSIM1 | QOMEAS | QOSIM1 | QOMEAS | QOSIM1 | QOMEAS | QOSIM1 | QOMEAS | QOSIM1 | |
| 2006-01 | 16.051613 | 8.225838 | 1.405484 | 0.946909 | 40.580645 | 16.610006 | 48.712903 | 17.792504 | 126.909677 | 70.970843 | ... | 0.650806 | 0.019036 | 333.483871 | 254.645845 | 455.935484 | 375.934287 | NaN | 5.525359 | 551.000000 | 429.582529 |
| 2006-02 | 15.846429 | 7.836855 | 1.571429 | 0.915010 | 39.996429 | 15.508414 | 35.882143 | 16.574135 | 106.760714 | 66.221449 | ... | 0.651821 | 0.017082 | 384.785714 | 260.034796 | 510.750000 | 381.921454 | NaN | 4.551649 | 544.071429 | 423.097793 |
| 2006-03 | 16.003226 | 7.655809 | 1.990000 | 0.950222 | 44.274194 | 14.299110 | 46.151613 | 15.413685 | 129.729032 | 52.458506 | ... | 2.067484 | 0.015913 | 343.806452 | 190.776139 | 511.129032 | 349.828097 | 3.079032 | 3.923205 | 621.774194 | 392.283106 |
| 2006-04 | 31.533333 | 23.350474 | 4.254000 | 6.237843 | 79.793333 | 78.426664 | 85.846667 | 71.977764 | 197.133333 | 117.830860 | ... | 1.373633 | 0.255665 | 232.800000 | 151.608927 | 729.200000 | 788.430373 | 42.630000 | 129.447612 | 1367.133333 | 1698.059350 |
| 2006-05 | 95.264516 | 84.046518 | 2.136129 | 1.026433 | 141.583871 | 220.756065 | 150.567742 | 220.634213 | 237.967742 | 256.703713 | ... | 0.608806 | 0.028659 | 241.612903 | 124.228568 | 497.967742 | 268.682623 | 38.916129 | 26.825047 | 1231.612903 | 460.000813 |
| ... | ... | ... | ... | ... | ... | ... | ... | ... | ... | ... | ... | ... | ... | ... | ... | ... | ... | ... | ... | ... | ... |
| 2016-08 | 24.200000 | 29.918573 | 2.529677 | 2.406282 | 32.632258 | 68.646506 | 42.858065 | 94.268124 | 157.903226 | 153.630194 | ... | 1.743548 | 0.112340 | 85.151613 | 164.329645 | 435.258065 | 443.391848 | 16.401935 | 4.582728 | 837.096774 | 587.681735 |
| 2016-09 | 24.160000 | 14.077718 | 1.651333 | 1.130971 | 31.803333 | 46.823969 | 40.746667 | 61.136598 | 108.366667 | 91.509543 | ... | 1.052067 | 0.599634 | 86.393333 | 184.826373 | 493.366667 | 520.491270 | 9.198000 | 3.699495 | 909.100000 | 624.611323 |
| 2016-10 | 27.822581 | 9.746621 | 0.927323 | 1.156395 | 69.274194 | 18.652897 | 75.500000 | 22.810266 | 153.593548 | 57.389961 | ... | 4.847742 | 3.314990 | 166.870968 | 181.337132 | 438.774194 | 400.217361 | 28.811613 | 26.298087 | 967.258065 | 752.227632 |
| 2016-11 | 28.163333 | 8.297580 | 0.919933 | 0.850107 | 97.903333 | 17.430480 | 107.773333 | 19.267389 | 177.633333 | 54.710942 | ... | 4.424833 | 0.169327 | 253.966667 | 197.939163 | 418.633333 | 403.751137 | NaN | 22.435290 | 1122.533333 | 640.480813 |
| 2016-12 | 9.148387 | 0.711909 | 0.824484 | 0.518178 | 27.780645 | 7.252084 | 31.574194 | 8.251751 | 88.025806 | 39.852518 | ... | 1.986774 | 0.134511 | 261.258065 | 229.418984 | 357.096774 | 357.076681 | NaN | 0.886834 | 716.645161 | 390.551797 |
132 rows × 72 columns
[10]:
data.monthly_aggregate(df=merged_df) # default method of aggregation is mean
[10]:
| Station Number | 05AA024 | 05AC003 | 05AD007 | 05AG006 | 05AJ001 | ... | 05HD039 | 05HG001 | 05KD003 | 05KE002 | 05KJ001 | ||||||||||
|---|---|---|---|---|---|---|---|---|---|---|---|---|---|---|---|---|---|---|---|---|---|
| QOMEAS | QOSIM1 | QOMEAS | QOSIM1 | QOMEAS | QOSIM1 | QOMEAS | QOSIM1 | QOMEAS | QOSIM1 | ... | QOMEAS | QOSIM1 | QOMEAS | QOSIM1 | QOMEAS | QOSIM1 | QOMEAS | QOSIM1 | QOMEAS | QOSIM1 | |
| 2006-01 | 16.051613 | 8.225838 | 1.405484 | 0.946909 | 40.580645 | 16.610006 | 48.712903 | 17.792504 | 126.909677 | 70.970843 | ... | 0.650806 | 0.019036 | 333.483871 | 254.645845 | 455.935484 | 375.934287 | NaN | 5.525359 | 551.000000 | 429.582529 |
| 2006-02 | 15.846429 | 7.836855 | 1.571429 | 0.915010 | 39.996429 | 15.508414 | 35.882143 | 16.574135 | 106.760714 | 66.221449 | ... | 0.651821 | 0.017082 | 384.785714 | 260.034796 | 510.750000 | 381.921454 | NaN | 4.551649 | 544.071429 | 423.097793 |
| 2006-03 | 16.003226 | 7.655809 | 1.990000 | 0.950222 | 44.274194 | 14.299110 | 46.151613 | 15.413685 | 129.729032 | 52.458506 | ... | 2.067484 | 0.015913 | 343.806452 | 190.776139 | 511.129032 | 349.828097 | 3.079032 | 3.923205 | 621.774194 | 392.283106 |
| 2006-04 | 31.533333 | 23.350474 | 4.254000 | 6.237843 | 79.793333 | 78.426664 | 85.846667 | 71.977764 | 197.133333 | 117.830860 | ... | 1.373633 | 0.255665 | 232.800000 | 151.608927 | 729.200000 | 788.430373 | 42.630000 | 129.447612 | 1367.133333 | 1698.059350 |
| 2006-05 | 95.264516 | 84.046518 | 2.136129 | 1.026433 | 141.583871 | 220.756065 | 150.567742 | 220.634213 | 237.967742 | 256.703713 | ... | 0.608806 | 0.028659 | 241.612903 | 124.228568 | 497.967742 | 268.682623 | 38.916129 | 26.825047 | 1231.612903 | 460.000813 |
| ... | ... | ... | ... | ... | ... | ... | ... | ... | ... | ... | ... | ... | ... | ... | ... | ... | ... | ... | ... | ... | ... |
| 2016-08 | 24.200000 | 29.918573 | 2.529677 | 2.406282 | 32.632258 | 68.646506 | 42.858065 | 94.268124 | 157.903226 | 153.630194 | ... | 1.743548 | 0.112340 | 85.151613 | 164.329645 | 435.258065 | 443.391848 | 16.401935 | 4.582728 | 837.096774 | 587.681735 |
| 2016-09 | 24.160000 | 14.077718 | 1.651333 | 1.130971 | 31.803333 | 46.823969 | 40.746667 | 61.136598 | 108.366667 | 91.509543 | ... | 1.052067 | 0.599634 | 86.393333 | 184.826373 | 493.366667 | 520.491270 | 9.198000 | 3.699495 | 909.100000 | 624.611323 |
| 2016-10 | 27.822581 | 9.746621 | 0.927323 | 1.156395 | 69.274194 | 18.652897 | 75.500000 | 22.810266 | 153.593548 | 57.389961 | ... | 4.847742 | 3.314990 | 166.870968 | 181.337132 | 438.774194 | 400.217361 | 28.811613 | 26.298087 | 967.258065 | 752.227632 |
| 2016-11 | 28.163333 | 8.297580 | 0.919933 | 0.850107 | 97.903333 | 17.430480 | 107.773333 | 19.267389 | 177.633333 | 54.710942 | ... | 4.424833 | 0.169327 | 253.966667 | 197.939163 | 418.633333 | 403.751137 | NaN | 22.435290 | 1122.533333 | 640.480813 |
| 2016-12 | 9.148387 | 0.711909 | 0.824484 | 0.518178 | 27.780645 | 7.252084 | 31.574194 | 8.251751 | 88.025806 | 39.852518 | ... | 1.986774 | 0.134511 | 261.258065 | 229.418984 | 357.096774 | 357.076681 | NaN | 0.886834 | 716.645161 | 390.551797 |
132 rows × 72 columns
[11]:
data.stat_aggregate(df=merged_df, method='q25')
[11]:
| 05AA024 | 05AC003 | 05AD007 | 05AG006 | 05AJ001 | 05BA001 | 05BB001 | 05BG010 | 05BH004 | 05BL024 | ... | 05FA001 | 05FC001 | 05FC008 | 05FE004 | 05GG001 | 05HD039 | 05HG001 | 05KD003 | 05KE002 | 05KJ001 | |
|---|---|---|---|---|---|---|---|---|---|---|---|---|---|---|---|---|---|---|---|---|---|
| Q25 | Q25 | Q25 | Q25 | Q25 | Q25 | Q25 | Q25 | Q25 | Q25 | ... | Q25 | Q25 | Q25 | Q25 | Q25 | Q25 | Q25 | Q25 | Q25 | Q25 | |
| 2006-01-01 | 8.251542 | 0.934610 | 18.313040 | 19.312690 | 77.77477 | 1.183666 | 5.252231 | 0.431461 | 52.85093 | 1.342807 | ... | 0.002308 | 0.027697 | 0.609218 | 6.532234 | 131.1006 | 0.021097 | 243.9071 | 279.7522 | 6.080291 | 458.8904 |
| 2006-01-02 | 8.268182 | 0.927514 | 17.737730 | 19.291240 | 77.72770 | 1.172835 | 5.207210 | 0.425622 | 48.89791 | 1.334097 | ... | 0.002239 | 0.026929 | 0.607228 | 6.504723 | 130.5874 | 0.020869 | 246.0166 | 253.4234 | 6.043128 | 457.1690 |
| 2006-01-03 | 8.268285 | 0.922706 | 16.954540 | 19.268370 | 77.68994 | 1.161657 | 5.161536 | 0.419869 | 47.83511 | 1.325669 | ... | 0.002174 | 0.026189 | 0.605276 | 6.477517 | 130.1418 | 0.020657 | 263.2702 | 287.3772 | 6.003728 | 445.3347 |
| 2006-01-04 | 8.265919 | 0.919975 | 16.726120 | 19.212070 | 77.65980 | 1.150785 | 5.116543 | 0.414203 | 47.67530 | 1.318301 | ... | 0.002110 | 0.025478 | 0.603361 | 6.450729 | 129.7527 | 0.020458 | 275.0443 | 318.6789 | 5.961734 | 390.2301 |
| 2006-01-05 | 8.263036 | 0.918143 | 16.695080 | 19.003410 | 77.61514 | 1.140337 | 5.070806 | 0.408606 | 47.65258 | 1.306869 | ... | 0.002049 | 0.024793 | 0.601481 | 6.424485 | 129.4009 | 0.020272 | 275.7499 | 341.7578 | 5.921951 | 336.3000 |
| ... | ... | ... | ... | ... | ... | ... | ... | ... | ... | ... | ... | ... | ... | ... | ... | ... | ... | ... | ... | ... | ... |
| 2016-12-27 | 0.655629 | 0.528861 | 7.048034 | 7.151505 | 34.76269 | 1.259803 | 4.608318 | 0.279653 | 21.76819 | 0.370559 | ... | 0.017074 | 0.064395 | 0.116672 | 0.393923 | 114.1589 | 0.099204 | 223.4322 | 353.2743 | 0.802104 | 382.5126 |
| 2016-12-28 | 0.652242 | 0.534474 | 7.042959 | 7.145447 | 34.57685 | 1.248078 | 4.566650 | 0.277161 | 21.25079 | 0.361210 | ... | 0.016876 | 0.062579 | 0.114247 | 0.392005 | 113.7905 | 0.092179 | 223.0046 | 353.3249 | 0.799029 | 381.3967 |
| 2016-12-29 | 0.648954 | 0.539484 | 7.037765 | 7.139501 | 34.38791 | 1.236539 | 4.525266 | 0.274679 | 20.95304 | 0.352394 | ... | 0.016695 | 0.060817 | 0.111877 | 0.389987 | 113.4777 | 0.085633 | 222.7246 | 353.5526 | 0.795955 | 380.3037 |
| 2016-12-30 | 0.645164 | 0.543866 | 7.032383 | 7.133636 | 34.19665 | 1.225125 | 4.478406 | 0.272189 | 20.67565 | 0.344078 | ... | 0.016528 | 0.059110 | 0.109558 | 0.387873 | 113.2033 | 0.079540 | 222.7773 | 350.5949 | 0.792732 | 379.8543 |
| 2016-12-31 | 0.642502 | 0.547652 | 7.026749 | 7.127830 | 34.00348 | 1.213826 | 4.433925 | 0.269717 | 20.40675 | 0.336003 | ... | 0.016373 | 0.057458 | 0.107288 | 0.385667 | 112.9515 | 0.073904 | 224.0186 | 349.6316 | 0.789295 | 379.1852 |
4018 rows × 36 columns
[12]:
data.seasonal_period(df=merged_df, daily_period=('01-01', '01-10')) # Returns the first 10 days of the year each year
[12]:
| Station Number | 05AA024 | 05AC003 | 05AD007 | 05AG006 | 05AJ001 | ... | 05HD039 | 05HG001 | 05KD003 | 05KE002 | 05KJ001 | ||||||||||
|---|---|---|---|---|---|---|---|---|---|---|---|---|---|---|---|---|---|---|---|---|---|
| QOMEAS | QOSIM1 | QOMEAS | QOSIM1 | QOMEAS | QOSIM1 | QOMEAS | QOSIM1 | QOMEAS | QOSIM1 | ... | QOMEAS | QOSIM1 | QOMEAS | QOSIM1 | QOMEAS | QOSIM1 | QOMEAS | QOSIM1 | QOMEAS | QOSIM1 | |
| 2006-01-01 | 16.20 | 8.251542 | 1.250 | 0.934610 | 41.3 | 18.31304 | 52.3 | 19.31269 | 144.0 | 77.77477 | ... | 0.363 | 0.021097 | 245.0 | 243.9071 | 317.0 | 279.7522 | NaN | 6.080291 | 580.0 | 458.8904 |
| 2006-01-02 | 16.20 | 8.268182 | 1.260 | 0.927514 | 41.9 | 17.73773 | 53.0 | 19.29124 | 147.0 | 77.72770 | ... | 0.408 | 0.020869 | 250.0 | 246.0166 | 312.0 | 253.4234 | NaN | 6.043128 | 577.0 | 457.1690 |
| 2006-01-03 | 16.10 | 8.268285 | 1.280 | 0.922706 | 42.1 | 16.95454 | 53.3 | 19.26837 | 145.0 | 77.68994 | ... | 0.504 | 0.020657 | 247.0 | 263.2702 | 324.0 | 287.3772 | NaN | 6.003728 | 574.0 | 445.3347 |
| 2006-01-04 | 16.10 | 8.265919 | 1.300 | 0.919975 | 42.4 | 16.72612 | 54.5 | 19.21207 | 146.0 | 77.65980 | ... | 0.524 | 0.020458 | 251.0 | 275.0443 | 372.0 | 318.6789 | NaN | 5.961734 | 570.0 | 390.2301 |
| 2006-01-05 | 16.10 | 8.263036 | 1.350 | 0.918143 | 43.1 | 16.69508 | 54.1 | 19.00341 | 147.0 | 77.61514 | ... | 0.487 | 0.020272 | 282.0 | 275.7499 | 569.0 | 341.7578 | NaN | 5.921951 | 565.0 | 336.3000 |
| ... | ... | ... | ... | ... | ... | ... | ... | ... | ... | ... | ... | ... | ... | ... | ... | ... | ... | ... | ... | ... | ... |
| 2016-01-06 | 8.32 | 6.786924 | 0.846 | 1.213170 | 12.3 | 11.28288 | 14.5 | 12.48631 | 64.0 | 49.91035 | ... | 0.335 | 0.010655 | 240.0 | 242.6372 | 343.0 | 315.4875 | NaN | 0.274514 | 419.0 | 264.6857 |
| 2016-01-07 | 8.34 | 6.782875 | 0.638 | 1.216702 | 12.2 | 11.26308 | 14.5 | 12.30296 | 64.0 | 49.87962 | ... | 0.388 | 0.010467 | 239.0 | 242.2403 | 305.0 | 322.5291 | NaN | 0.273795 | 420.0 | 265.6581 |
| 2016-01-08 | 8.35 | 6.779193 | 0.519 | 1.215545 | 12.4 | 11.24641 | 15.3 | 12.09614 | 65.7 | 50.71675 | ... | 0.401 | 0.010290 | 236.0 | 241.4810 | 373.0 | 328.6615 | NaN | 0.273079 | 423.0 | 282.3662 |
| 2016-01-09 | 8.53 | 6.777290 | 0.516 | 1.213800 | 12.9 | 11.23008 | 15.5 | 11.91888 | 69.7 | 52.63040 | ... | 0.446 | 0.010122 | 233.0 | 240.9934 | 365.0 | 335.8596 | NaN | 0.272357 | 427.0 | 304.2121 |
| 2016-01-10 | 8.72 | 6.776233 | 0.653 | 1.213728 | 13.4 | 11.21424 | 15.2 | 11.79533 | 72.6 | 54.34034 | ... | 0.488 | 0.009963 | 227.0 | 240.6326 | 315.0 | 343.4353 | NaN | 0.271641 | 430.0 | 320.0995 |
110 rows × 72 columns
[13]:
data.long_term_seasonal(df=merged_df) # As usual the default aggregation method is mean/average
[13]:
| Station Number | 05AA024 | 05AC003 | 05AD007 | 05AG006 | 05AJ001 | ... | 05HD039 | 05HG001 | 05KD003 | 05KE002 | 05KJ001 | ||||||||||
|---|---|---|---|---|---|---|---|---|---|---|---|---|---|---|---|---|---|---|---|---|---|
| QOMEAS | QOSIM1 | QOMEAS | QOSIM1 | QOMEAS | QOSIM1 | QOMEAS | QOSIM1 | QOMEAS | QOSIM1 | ... | QOMEAS | QOSIM1 | QOMEAS | QOSIM1 | QOMEAS | QOSIM1 | QOMEAS | QOSIM1 | QOMEAS | QOSIM1 | |
| jday | |||||||||||||||||||||
| 1 | 11.068182 | 7.623865 | 1.590000 | 1.043135 | 22.690909 | 16.025414 | 25.200000 | 16.628596 | 84.281818 | 55.890074 | ... | 0.610364 | 0.030600 | 257.090909 | 231.309264 | 336.909091 | 275.303045 | NaN | 1.185507 | 390.090909 | 385.450218 |
| 2 | 11.072727 | 7.501612 | 1.610909 | 1.037899 | 21.727273 | 15.661661 | 24.845455 | 16.595819 | 83.300000 | 55.590134 | ... | 0.651727 | 0.030257 | 256.818182 | 232.405536 | 341.000000 | 253.766491 | NaN | 1.179464 | 388.363636 | 384.061418 |
| 3 | 11.114545 | 7.477458 | 1.546727 | 1.033031 | 21.281818 | 15.060059 | 25.072727 | 16.566723 | 82.000000 | 55.238464 | ... | 0.544545 | 0.029927 | 251.000000 | 243.117736 | 364.727273 | 263.590873 | NaN | 1.173183 | 388.909091 | 377.242455 |
| 4 | 11.160909 | 7.470017 | 1.585455 | 1.029967 | 20.927273 | 14.761656 | 25.400000 | 16.522690 | 83.927273 | 54.855249 | ... | 0.473727 | 0.029610 | 256.909091 | 251.656918 | 377.545455 | 286.812655 | NaN | 1.166656 | 390.545455 | 339.648564 |
| 5 | 11.213636 | 7.465469 | 1.642727 | 1.028979 | 20.409091 | 14.645289 | 25.781818 | 16.393980 | 86.290909 | 54.449069 | ... | 0.498818 | 0.029305 | 256.363636 | 252.713245 | 415.909091 | 309.169045 | NaN | 1.160344 | 393.272727 | 294.889764 |
| ... | ... | ... | ... | ... | ... | ... | ... | ... | ... | ... | ... | ... | ... | ... | ... | ... | ... | ... | ... | ... | ... |
| 362 | 10.327273 | 7.086695 | 1.419818 | 1.011742 | 20.009091 | 15.128755 | 22.309091 | 15.724457 | 77.600000 | 53.060251 | ... | 0.774727 | 0.039169 | 241.636364 | 232.275618 | 303.363636 | 367.953491 | NaN | 0.716424 | 407.636364 | 378.881791 |
| 363 | 10.329091 | 7.084431 | 1.495455 | 1.011954 | 20.200000 | 15.101584 | 22.218182 | 15.667003 | 78.745455 | 52.794602 | ... | 0.743545 | 0.038151 | 246.000000 | 231.567245 | 288.090909 | 366.944364 | NaN | 0.713457 | 401.636364 | 379.824609 |
| 364 | 10.346364 | 7.082186 | 1.597273 | 1.011607 | 20.527273 | 15.075794 | 22.281818 | 15.611506 | 80.981818 | 52.521131 | ... | 0.811636 | 0.037191 | 245.909091 | 230.985891 | 311.090909 | 365.728291 | NaN | 0.710537 | 397.636364 | 379.922091 |
| 365 | 10.348182 | 7.079909 | 1.551818 | 1.010601 | 20.609091 | 15.050649 | 22.527273 | 15.564291 | 81.245455 | 52.239721 | ... | 0.832091 | 0.036287 | 252.727273 | 230.286855 | 339.454545 | 364.134518 | NaN | 0.707642 | 394.636364 | 379.392164 |
| 366 | 8.576667 | 5.331896 | 1.383333 | 0.786592 | 25.800000 | 12.432943 | 22.566667 | 12.757130 | 78.933333 | 44.663073 | ... | 0.824667 | 0.035837 | 276.000000 | 227.051633 | 336.666667 | 360.720500 | NaN | 0.550094 | 411.000000 | 377.839667 |
366 rows × 72 columns
[14]:
data.stat_aggregate(df=data.long_term_seasonal(df=merged_df, method='median'), method='median')
[14]:
| 05AA024 | 05AC003 | 05AD007 | 05AG006 | 05AJ001 | 05BA001 | 05BB001 | 05BG010 | 05BH004 | 05BL024 | ... | 05FA001 | 05FC001 | 05FC008 | 05FE004 | 05GG001 | 05HD039 | 05HG001 | 05KD003 | 05KE002 | 05KJ001 | |
|---|---|---|---|---|---|---|---|---|---|---|---|---|---|---|---|---|---|---|---|---|---|
| MEDIAN | MEDIAN | MEDIAN | MEDIAN | MEDIAN | MEDIAN | MEDIAN | MEDIAN | MEDIAN | MEDIAN | ... | MEDIAN | MEDIAN | MEDIAN | MEDIAN | MEDIAN | MEDIAN | MEDIAN | MEDIAN | MEDIAN | MEDIAN | |
| jday | |||||||||||||||||||||
| 1 | 7.574007 | 0.950668 | 15.19819 | 15.89087 | 51.63991 | 1.183666 | 4.117046 | 0.308214 | 33.28933 | 1.342807 | ... | 0.004772 | 0.050001 | 0.256009 | 0.742731 | 115.1368 | 0.013681 | 228.8185 | 275.3788 | 0.628797 | 379.0888 |
| 2 | 7.479002 | 0.955941 | 14.90612 | 15.86760 | 51.20120 | 1.172835 | 4.069810 | 0.304629 | 38.48943 | 1.334097 | ... | 0.004566 | 0.048351 | 0.253426 | 0.741573 | 114.8739 | 0.013576 | 229.2393 | 254.0947 | 0.625451 | 379.0011 |
| 3 | 7.458900 | 0.960607 | 14.44986 | 15.84433 | 50.94381 | 1.161657 | 4.022910 | 0.301090 | 41.11936 | 1.325669 | ... | 0.004372 | 0.046769 | 0.250904 | 0.740326 | 114.6126 | 0.013478 | 238.8437 | 255.5462 | 0.622218 | 374.1664 |
| 4 | 7.451136 | 0.964515 | 14.24045 | 15.80896 | 50.72528 | 1.150785 | 3.976928 | 0.297592 | 41.14963 | 1.318301 | ... | 0.004189 | 0.045253 | 0.248438 | 0.738977 | 114.3529 | 0.013386 | 246.5980 | 278.5749 | 0.619057 | 339.4591 |
| 5 | 7.445426 | 0.962528 | 14.19060 | 15.71270 | 50.53224 | 1.137722 | 3.931897 | 0.294149 | 40.75410 | 1.306869 | ... | 0.004017 | 0.043800 | 0.246026 | 0.737517 | 114.0947 | 0.013299 | 247.5860 | 302.3437 | 0.615910 | 292.4359 |
| ... | ... | ... | ... | ... | ... | ... | ... | ... | ... | ... | ... | ... | ... | ... | ... | ... | ... | ... | ... | ... | ... |
| 362 | 7.692451 | 0.945497 | 14.85478 | 15.08812 | 52.63409 | 1.249459 | 4.298340 | 0.293281 | 33.15593 | 0.811968 | ... | 0.017074 | 0.062028 | 0.227518 | 0.718802 | 115.9537 | 0.014442 | 230.2822 | 361.1377 | 0.642829 | 382.3588 |
| 363 | 7.690284 | 0.933742 | 14.83068 | 15.06748 | 52.38522 | 1.234790 | 4.253545 | 0.290606 | 33.01368 | 0.794124 | ... | 0.016876 | 0.061076 | 0.222977 | 0.711583 | 115.5785 | 0.014146 | 230.2680 | 360.6638 | 0.639264 | 381.3967 |
| 364 | 7.688163 | 0.929169 | 14.80670 | 15.04713 | 52.10855 | 1.220329 | 4.209558 | 0.287977 | 32.87157 | 0.780021 | ... | 0.016695 | 0.060177 | 0.218616 | 0.704597 | 115.2513 | 0.013911 | 229.3687 | 357.9292 | 0.635741 | 380.3037 |
| 365 | 7.686083 | 0.935499 | 14.78280 | 15.02705 | 51.80764 | 1.206072 | 4.163783 | 0.285383 | 32.73086 | 0.769722 | ... | 0.016528 | 0.059110 | 0.214426 | 0.697835 | 114.9539 | 0.013792 | 228.4871 | 359.7653 | 0.632243 | 379.8543 |
| 366 | 7.605867 | 0.867881 | 14.58051 | 14.88280 | 42.98656 | 1.213826 | 4.433925 | 0.269717 | 22.63276 | 1.470117 | ... | 0.016373 | 0.057458 | 0.210399 | 0.985606 | 113.6510 | 0.021806 | 227.4222 | 349.6316 | 0.526121 | 379.1852 |
366 rows × 36 columns
As usual, you can also request all these right from the generate_dataframes() function by specifying the extra parameters as shown below
[15]:
DATAFRAMES = data.generate_dataframes(csv_fpaths=csv_3, start_date = start_dates,
                                      daily_agg = True, da_method = 'min',
                                      weekly_agg = True, wa_method = 'min',
                                      monthly_agg = True, ma_method = 'inst',
                                      yearly_agg = True, ya_method = 'sum',
                                      stat_agg = True, stat_method = 'q75',
                                      seasonal_p = True, sp_dperiod = ('05-01', '08-30'), sp_subset = ('2006-01-01', '2010-12-31'),
                                      long_term = True, lt_method = ["q33.33", "median" ,'q75' ,'Q25' ,'q33' ],
                                     )


for key, value in DATAFRAMES.items():
    print(f"{key}:\n{value}")
The start date for the Data is 2006-01-01
DF:
QOMEAS_05AA024 QOSIM_05AA024 QOMEAS_05AC003 QOSIM_05AC003 \
2006-01-01 16.20 8.251542 1.250 0.934610
2006-01-02 16.20 8.268182 1.260 0.927514
2006-01-03 16.10 8.268285 1.280 0.922706
2006-01-04 16.10 8.265919 1.300 0.919975
2006-01-05 16.10 8.263036 1.350 0.918143
... ... ... ... ...
2016-12-27 8.62 0.655629 0.966 0.528861
2016-12-28 8.64 0.652242 1.010 0.534474
2016-12-29 8.63 0.648954 1.030 0.539484
2016-12-30 8.64 0.645164 1.030 0.543866
2016-12-31 8.61 0.642502 1.010 0.547652
QOMEAS_05AD007 QOSIM_05AD007 QOMEAS_05AG006 QOSIM_05AG006 \
2006-01-01 41.3 18.313040 52.3 19.312690
2006-01-02 41.9 17.737730 53.0 19.291240
2006-01-03 42.1 16.954540 53.3 19.268370
2006-01-04 42.4 16.726120 54.5 19.212070
2006-01-05 43.1 16.695080 54.1 19.003410
... ... ... ... ...
2016-12-27 20.7 7.048034 21.7 7.151505
2016-12-28 22.0 7.042959 22.6 7.145447
2016-12-29 24.5 7.037765 24.3 7.139501
2016-12-30 25.5 7.032383 25.7 7.133636
2016-12-31 25.1 7.026749 25.8 7.127830
QOMEAS_05AJ001 QOSIM_05AJ001 ... QOMEAS_05HD039 QOSIM_05HD039 \
2006-01-01 144.0 77.77477 ... 0.363 0.021097
2006-01-02 147.0 77.72770 ... 0.408 0.020869
2006-01-03 145.0 77.68994 ... 0.504 0.020657
2006-01-04 146.0 77.65980 ... 0.524 0.020458
2006-01-05 147.0 77.61514 ... 0.487 0.020272
... ... ... ... ... ...
2016-12-27 82.6 34.76269 ... 1.650 0.099204
2016-12-28 85.5 34.57685 ... 1.670 0.092179
2016-12-29 86.4 34.38791 ... 1.700 0.085633
2016-12-30 85.6 34.19665 ... 1.700 0.079540
2016-12-31 83.5 34.00348 ... 1.710 0.073904
QOMEAS_05HG001 QOSIM_05HG001 QOMEAS_05KD003 QOSIM_05KD003 \
2006-01-01 245.0 243.9071 317.0 279.7522
2006-01-02 250.0 246.0166 312.0 253.4234
2006-01-03 247.0 263.2702 324.0 287.3772
2006-01-04 251.0 275.0443 372.0 318.6789
2006-01-05 282.0 275.7499 569.0 341.7578
... ... ... ... ...
2016-12-27 294.0 223.4322 301.0 353.2743
2016-12-28 291.0 223.0046 424.0 353.3249
2016-12-29 290.0 222.7246 450.0 353.5526
2016-12-30 291.0 222.7773 413.0 350.5949
2016-12-31 296.0 224.0186 415.0 349.6316
QOMEAS_05KE002 QOSIM_05KE002 QOMEAS_05KJ001 QOSIM_05KJ001
2006-01-01 NaN 6.080291 580.0 458.8904
2006-01-02 NaN 6.043128 577.0 457.1690
2006-01-03 NaN 6.003728 574.0 445.3347
2006-01-04 NaN 5.961734 570.0 390.2301
2006-01-05 NaN 5.921951 565.0 336.3000
... ... ... ... ...
2016-12-27 NaN 0.802104 646.0 382.5126
2016-12-28 NaN 0.799029 628.0 381.3967
2016-12-29 NaN 0.795955 615.0 380.3037
2016-12-30 NaN 0.792732 603.0 379.8543
2016-12-31 NaN 0.789295 597.0 379.1852
[4018 rows x 72 columns]
DF_OBSERVED:
QOMEAS_05AA024 QOMEAS_05AC003 QOMEAS_05AD007 QOMEAS_05AG006 \
2006-01-01 16.20 1.250 41.3 52.3
2006-01-02 16.20 1.260 41.9 53.0
2006-01-03 16.10 1.280 42.1 53.3
2006-01-04 16.10 1.300 42.4 54.5
2006-01-05 16.10 1.350 43.1 54.1
... ... ... ... ...
2016-12-27 8.62 0.966 20.7 21.7
2016-12-28 8.64 1.010 22.0 22.6
2016-12-29 8.63 1.030 24.5 24.3
2016-12-30 8.64 1.030 25.5 25.7
2016-12-31 8.61 1.010 25.1 25.8
QOMEAS_05AJ001 QOMEAS_05BA001 QOMEAS_05BB001 QOMEAS_05BG010 \
2006-01-01 144.0 NaN 12.7 3.71
2006-01-02 147.0 NaN 12.7 3.66
2006-01-03 145.0 NaN 12.7 3.63
2006-01-04 146.0 NaN 12.8 3.58
2006-01-05 147.0 NaN 12.7 3.55
... ... ... ... ...
2016-12-27 82.6 NaN 11.7 2.88
2016-12-28 85.5 NaN 12.2 2.86
2016-12-29 86.4 NaN 11.8 2.83
2016-12-30 85.6 NaN 11.5 2.82
2016-12-31 83.5 NaN 11.2 2.80
QOMEAS_05BH004 QOMEAS_05BL024 ... QOMEAS_05FA001 \
2006-01-01 64.7 8.30 ... 0.197
2006-01-02 66.2 8.33 ... 0.187
2006-01-03 67.5 8.03 ... 0.182
2006-01-04 69.0 7.42 ... 0.172
2006-01-05 70.4 7.50 ... 0.156
... ... ... ... ...
2016-12-27 36.4 3.69 ... 0.186
2016-12-28 35.8 3.96 ... 0.188
2016-12-29 43.1 4.15 ... 0.190
2016-12-30 42.6 4.27 ... 0.186
2016-12-31 45.0 4.32 ... 0.172
QOMEAS_05FC001 QOMEAS_05FC008 QOMEAS_05FE004 QOMEAS_05GG001 \
2006-01-01 NaN NaN 1.420 154.0
2006-01-02 NaN NaN 1.410 159.0
2006-01-03 NaN NaN 1.420 177.0
2006-01-04 NaN NaN 1.420 207.0
2006-01-05 NaN NaN 1.440 214.0
... ... ... ... ...
2016-12-27 NaN NaN 0.747 191.0
2016-12-28 NaN NaN 0.720 197.0
2016-12-29 NaN NaN 0.694 197.0
2016-12-30 NaN NaN 0.668 189.0
2016-12-31 NaN NaN 0.644 181.0
QOMEAS_05HD039 QOMEAS_05HG001 QOMEAS_05KD003 QOMEAS_05KE002 \
2006-01-01 0.363 245.0 317.0 NaN
2006-01-02 0.408 250.0 312.0 NaN
2006-01-03 0.504 247.0 324.0 NaN
2006-01-04 0.524 251.0 372.0 NaN
2006-01-05 0.487 282.0 569.0 NaN
... ... ... ... ...
2016-12-27 1.650 294.0 301.0 NaN
2016-12-28 1.670 291.0 424.0 NaN
2016-12-29 1.700 290.0 450.0 NaN
2016-12-30 1.700 291.0 413.0 NaN
2016-12-31 1.710 296.0 415.0 NaN
QOMEAS_05KJ001
2006-01-01 580.0
2006-01-02 577.0
2006-01-03 574.0
2006-01-04 570.0
2006-01-05 565.0
... ...
2016-12-27 646.0
2016-12-28 628.0
2016-12-29 615.0
2016-12-30 603.0
2016-12-31 597.0
[4018 rows x 36 columns]
DF_SIMULATED:
QOSIM_05AA024 QOSIM_05AC003 QOSIM_05AD007 QOSIM_05AG006 \
2006-01-01 8.251542 0.934610 18.313040 19.312690
2006-01-02 8.268182 0.927514 17.737730 19.291240
2006-01-03 8.268285 0.922706 16.954540 19.268370
2006-01-04 8.265919 0.919975 16.726120 19.212070
2006-01-05 8.263036 0.918143 16.695080 19.003410
... ... ... ... ...
2016-12-27 0.655629 0.528861 7.048034 7.151505
2016-12-28 0.652242 0.534474 7.042959 7.145447
2016-12-29 0.648954 0.539484 7.037765 7.139501
2016-12-30 0.645164 0.543866 7.032383 7.133636
2016-12-31 0.642502 0.547652 7.026749 7.127830
QOSIM_05AJ001 QOSIM_05BA001 QOSIM_05BB001 QOSIM_05BG010 \
2006-01-01 77.77477 1.183666 5.252231 0.431461
2006-01-02 77.72770 1.172835 5.207210 0.425622
2006-01-03 77.68994 1.161657 5.161536 0.419869
2006-01-04 77.65980 1.150785 5.116543 0.414203
2006-01-05 77.61514 1.140337 5.070806 0.408606
... ... ... ... ...
2016-12-27 34.76269 1.259803 4.608318 0.279653
2016-12-28 34.57685 1.248078 4.566650 0.277161
2016-12-29 34.38791 1.236539 4.525266 0.274679
2016-12-30 34.19665 1.225125 4.478406 0.272189
2016-12-31 34.00348 1.213826 4.433925 0.269717
QOSIM_05BH004 QOSIM_05BL024 ... QOSIM_05FA001 QOSIM_05FC001 \
2006-01-01 52.85093 1.342807 ... 0.002308 0.027697
2006-01-02 48.89791 1.334097 ... 0.002239 0.026929
2006-01-03 47.83511 1.325669 ... 0.002174 0.026189
2006-01-04 47.67530 1.318301 ... 0.002110 0.025478
2006-01-05 47.65258 1.306869 ... 0.002049 0.024793
... ... ... ... ... ...
2016-12-27 21.76819 0.370559 ... 0.017074 0.064395
2016-12-28 21.25079 0.361210 ... 0.016876 0.062579
2016-12-29 20.95304 0.352394 ... 0.016695 0.060817
2016-12-30 20.67565 0.344078 ... 0.016528 0.059110
2016-12-31 20.40675 0.336003 ... 0.016373 0.057458
QOSIM_05FC008 QOSIM_05FE004 QOSIM_05GG001 QOSIM_05HD039 \
2006-01-01 0.609218 6.532234 131.1006 0.021097
2006-01-02 0.607228 6.504723 130.5874 0.020869
2006-01-03 0.605276 6.477517 130.1418 0.020657
2006-01-04 0.603361 6.450729 129.7527 0.020458
2006-01-05 0.601481 6.424485 129.4009 0.020272
... ... ... ... ...
2016-12-27 0.116672 0.393923 114.1589 0.099204
2016-12-28 0.114247 0.392005 113.7905 0.092179
2016-12-29 0.111877 0.389987 113.4777 0.085633
2016-12-30 0.109558 0.387873 113.2033 0.079540
2016-12-31 0.107288 0.385667 112.9515 0.073904
QOSIM_05HG001 QOSIM_05KD003 QOSIM_05KE002 QOSIM_05KJ001
2006-01-01 243.9071 279.7522 6.080291 458.8904
2006-01-02 246.0166 253.4234 6.043128 457.1690
2006-01-03 263.2702 287.3772 6.003728 445.3347
2006-01-04 275.0443 318.6789 5.961734 390.2301
2006-01-05 275.7499 341.7578 5.921951 336.3000
... ... ... ... ...
2016-12-27 223.4322 353.2743 0.802104 382.5126
2016-12-28 223.0046 353.3249 0.799029 381.3967
2016-12-29 222.7246 353.5526 0.795955 380.3037
2016-12-30 222.7773 350.5949 0.792732 379.8543
2016-12-31 224.0186 349.6316 0.789295 379.1852
[4018 rows x 36 columns]
DF_MERGED:
Station1 Station2 Station3 Station4 \
QOMEAS QOSIM1 QOMEAS QOSIM1 QOMEAS QOSIM1 QOMEAS
2006-01-01 16.20 8.251542 1.250 0.934610 41.3 18.313040 52.3
2006-01-02 16.20 8.268182 1.260 0.927514 41.9 17.737730 53.0
2006-01-03 16.10 8.268285 1.280 0.922706 42.1 16.954540 53.3
2006-01-04 16.10 8.265919 1.300 0.919975 42.4 16.726120 54.5
2006-01-05 16.10 8.263036 1.350 0.918143 43.1 16.695080 54.1
... ... ... ... ... ... ... ...
2016-12-27 8.62 0.655629 0.966 0.528861 20.7 7.048034 21.7
2016-12-28 8.64 0.652242 1.010 0.534474 22.0 7.042959 22.6
2016-12-29 8.63 0.648954 1.030 0.539484 24.5 7.037765 24.3
2016-12-30 8.64 0.645164 1.030 0.543866 25.5 7.032383 25.7
2016-12-31 8.61 0.642502 1.010 0.547652 25.1 7.026749 25.8
Station5 ... Station32 Station33 \
QOSIM1 QOMEAS QOSIM1 ... QOMEAS QOSIM1 QOMEAS
2006-01-01 19.312690 144.0 77.77477 ... 0.363 0.021097 245.0
2006-01-02 19.291240 147.0 77.72770 ... 0.408 0.020869 250.0
2006-01-03 19.268370 145.0 77.68994 ... 0.504 0.020657 247.0
2006-01-04 19.212070 146.0 77.65980 ... 0.524 0.020458 251.0
2006-01-05 19.003410 147.0 77.61514 ... 0.487 0.020272 282.0
... ... ... ... ... ... ... ...
2016-12-27 7.151505 82.6 34.76269 ... 1.650 0.099204 294.0
2016-12-28 7.145447 85.5 34.57685 ... 1.670 0.092179 291.0
2016-12-29 7.139501 86.4 34.38791 ... 1.700 0.085633 290.0
2016-12-30 7.133636 85.6 34.19665 ... 1.700 0.079540 291.0
2016-12-31 7.127830 83.5 34.00348 ... 1.710 0.073904 296.0
Station34 Station35 Station36 \
QOSIM1 QOMEAS QOSIM1 QOMEAS QOSIM1 QOMEAS
2006-01-01 243.9071 317.0 279.7522 NaN 6.080291 580.0
2006-01-02 246.0166 312.0 253.4234 NaN 6.043128 577.0
2006-01-03 263.2702 324.0 287.3772 NaN 6.003728 574.0
2006-01-04 275.0443 372.0 318.6789 NaN 5.961734 570.0
2006-01-05 275.7499 569.0 341.7578 NaN 5.921951 565.0
... ... ... ... ... ... ...
2016-12-27 223.4322 301.0 353.2743 NaN 0.802104 646.0
2016-12-28 223.0046 424.0 353.3249 NaN 0.799029 628.0
2016-12-29 222.7246 450.0 353.5526 NaN 0.795955 615.0
2016-12-30 222.7773 413.0 350.5949 NaN 0.792732 603.0
2016-12-31 224.0186 415.0 349.6316 NaN 0.789295 597.0
QOSIM1
2006-01-01 458.8904
2006-01-02 457.1690
2006-01-03 445.3347
2006-01-04 390.2301
2006-01-05 336.3000
... ...
2016-12-27 382.5126
2016-12-28 381.3967
2016-12-29 380.3037
2016-12-30 379.8543
2016-12-31 379.1852
[4018 rows x 72 columns]
DF_DAILY:
Station1 Station2 Station3 Station4 \
QOMEAS QOSIM1 QOMEAS QOSIM1 QOMEAS QOSIM1 QOMEAS
2006/001 16.20 8.251542 1.250 0.934610 41.3 18.313040 52.3
2006/002 16.20 8.268182 1.260 0.927514 41.9 17.737730 53.0
2006/003 16.10 8.268285 1.280 0.922706 42.1 16.954540 53.3
2006/004 16.10 8.265919 1.300 0.919975 42.4 16.726120 54.5
2006/005 16.10 8.263036 1.350 0.918143 43.1 16.695080 54.1
... ... ... ... ... ... ... ...
2016/362 8.62 0.655629 0.966 0.528861 20.7 7.048034 21.7
2016/363 8.64 0.652242 1.010 0.534474 22.0 7.042959 22.6
2016/364 8.63 0.648954 1.030 0.539484 24.5 7.037765 24.3
2016/365 8.64 0.645164 1.030 0.543866 25.5 7.032383 25.7
2016/366 8.61 0.642502 1.010 0.547652 25.1 7.026749 25.8
Station5 ... Station32 Station33 \
QOSIM1 QOMEAS QOSIM1 ... QOMEAS QOSIM1 QOMEAS
2006/001 19.312690 144.0 77.77477 ... 0.363 0.021097 245.0
2006/002 19.291240 147.0 77.72770 ... 0.408 0.020869 250.0
2006/003 19.268370 145.0 77.68994 ... 0.504 0.020657 247.0
2006/004 19.212070 146.0 77.65980 ... 0.524 0.020458 251.0
2006/005 19.003410 147.0 77.61514 ... 0.487 0.020272 282.0
... ... ... ... ... ... ... ...
2016/362 7.151505 82.6 34.76269 ... 1.650 0.099204 294.0
2016/363 7.145447 85.5 34.57685 ... 1.670 0.092179 291.0
2016/364 7.139501 86.4 34.38791 ... 1.700 0.085633 290.0
2016/365 7.133636 85.6 34.19665 ... 1.700 0.079540 291.0
2016/366 7.127830 83.5 34.00348 ... 1.710 0.073904 296.0
Station34 Station35 Station36
QOSIM1 QOMEAS QOSIM1 QOMEAS QOSIM1 QOMEAS QOSIM1
2006/001 243.9071 317.0 279.7522 NaN 6.080291 580.0 458.8904
2006/002 246.0166 312.0 253.4234 NaN 6.043128 577.0 457.1690
2006/003 263.2702 324.0 287.3772 NaN 6.003728 574.0 445.3347
2006/004 275.0443 372.0 318.6789 NaN 5.961734 570.0 390.2301
2006/005 275.7499 569.0 341.7578 NaN 5.921951 565.0 336.3000
... ... ... ... ... ... ... ...
2016/362 223.4322 301.0 353.2743 NaN 0.802104 646.0 382.5126
2016/363 223.0046 424.0 353.3249 NaN 0.799029 628.0 381.3967
2016/364 222.7246 450.0 353.5526 NaN 0.795955 615.0 380.3037
2016/365 222.7773 413.0 350.5949 NaN 0.792732 603.0 379.8543
2016/366 224.0186 415.0 349.6316 NaN 0.789295 597.0 379.1852
[4018 rows x 72 columns]
DF_WEEKLY:
Station1 Station2 Station3 Station4 \
QOMEAS QOSIM1 QOMEAS QOSIM1 QOMEAS QOSIM1 QOMEAS
2005-12-26 16.20 8.251542 1.250 0.934610 41.3 18.313040 52.3
2006-01-02 16.00 8.254107 1.260 0.917379 39.7 16.660410 52.1
2006-01-09 15.90 8.231481 1.280 0.929428 36.0 16.537240 48.1
2006-01-16 16.00 8.207191 1.250 0.973028 35.0 16.422070 37.9
2006-01-23 16.00 8.181830 1.350 0.904176 34.1 16.303530 42.6
... ... ... ... ... ... ... ...
2016-11-28 10.00 0.785171 0.505 0.478892 56.4 7.649075 73.6
2016-12-05 7.88 0.717317 0.493 0.514685 14.7 7.159668 15.2
2016-12-12 7.97 0.686399 0.744 0.503244 15.7 7.094969 17.0
2016-12-19 8.60 0.662961 0.899 0.504818 18.7 7.058456 20.1
2016-12-26 8.61 0.642502 0.924 0.523137 20.7 7.026749 21.7
Station5 ... Station32 Station33 \
QOSIM1 QOMEAS QOSIM1 ... QOMEAS QOSIM1 QOMEAS
2005-12-26 19.312690 144.0 77.77477 ... 0.363 0.021097 245.0
2006-01-02 17.849780 142.0 73.28921 ... 0.408 0.019781 247.0
2006-01-09 17.494940 127.0 69.07361 ... 0.598 0.018929 296.0
2006-01-16 17.392310 97.3 68.64463 ... 0.626 0.018334 341.0
2006-01-23 17.293130 97.3 68.37852 ... 0.546 0.017881 371.0
... ... ... ... ... ... ... ...
2016-11-28 10.833400 101.0 44.29698 ... 1.910 0.122036 252.0
2016-12-05 7.664602 77.4 40.06047 ... 1.390 0.138888 132.0
2016-12-12 7.236629 77.6 37.44972 ... 1.320 0.149132 222.0
2016-12-19 7.164339 79.1 35.19276 ... 1.650 0.117698 261.0
2016-12-26 7.127830 79.5 34.00348 ... 1.650 0.073904 290.0
Station34 Station35 Station36 \
QOSIM1 QOMEAS QOSIM1 QOMEAS QOSIM1 QOMEAS
2005-12-26 243.9071 317.0 279.7522 NaN 6.080291 580.0
2006-01-02 246.0166 312.0 253.4234 NaN 5.805296 555.0
2006-01-09 256.3097 249.0 385.1438 NaN 5.563248 548.0
2006-01-16 247.3920 328.0 396.6066 NaN 5.332893 544.0
2006-01-23 241.6220 361.0 376.3933 NaN 5.035362 541.0
... ... ... ... ... ... ...
2016-11-28 186.8868 206.0 337.1765 NaN 1.013356 806.0
2016-12-05 239.5872 267.0 318.6339 NaN 0.904626 742.0
2016-12-12 233.1316 250.0 355.3849 NaN 0.849336 697.0
2016-12-19 225.9086 311.0 352.9541 NaN 0.808453 679.0
2016-12-26 222.7246 299.0 349.6316 NaN 0.789295 597.0
QOSIM1
2005-12-26 458.8904
2006-01-02 327.0207
2006-01-09 400.8380
2006-01-16 450.9163
2006-01-23 435.6758
... ...
2016-11-28 401.5735
2016-12-05 354.7483
2016-12-12 357.0647
2016-12-19 381.2140
2016-12-26 379.1852
[575 rows x 72 columns]
DF_MONTHLY:
Station1 Station2 Station3 Station4 \
QOMEAS QOSIM1 QOMEAS QOSIM1 QOMEAS QOSIM1 QOMEAS
2006-01 16.00 8.174577 1.600 0.898622 45.3 16.271100 49.3
2006-02 15.80 7.799765 1.850 0.958113 46.1 15.283840 38.0
2006-03 15.90 7.533010 3.960 0.902106 46.0 14.749020 53.2
2006-04 35.20 158.641100 2.580 0.942184 64.6 189.527700 76.4
2006-05 95.00 102.401700 2.470 1.397454 208.0 251.252700 238.0
... ... ... ... ... ... ... ...
2016-08 23.30 29.272040 1.940 1.082551 29.7 63.360900 39.0
2016-09 22.70 3.020598 0.940 1.388958 34.9 35.798980 46.2
2016-10 34.70 11.785820 0.935 1.109411 113.0 22.427750 118.0
2016-11 20.00 1.038698 0.505 0.497926 77.4 9.086623 93.4
2016-12 8.61 0.642502 1.010 0.547652 25.1 7.026749 25.8
Station5 ... Station32 Station33 \
QOSIM1 QOMEAS QOSIM1 ... QOMEAS QOSIM1 QOMEAS
2006-01 17.25808 124.0 68.35151 ... 0.751 0.017767 388.0
2006-02 16.25441 105.0 57.64237 ... 0.834 0.016511 365.0
2006-03 15.43267 220.0 48.23196 ... 6.650 0.015381 355.0
2006-04 83.16133 122.0 113.27710 ... 0.491 0.092228 265.0
2006-05 251.59150 506.0 323.53350 ... 1.010 0.028658 265.0
... ... ... ... ... ... ... ...
2016-08 76.56909 113.0 109.00900 ... 0.540 0.001863 84.9
2016-09 60.61516 106.0 98.64054 ... 1.470 1.646531 159.0
2016-10 22.51817 194.0 53.56444 ... 6.020 0.426811 242.0
2016-11 16.40094 142.0 48.65834 ... 3.250 0.127110 285.0
2016-12 7.12783 83.5 34.00348 ... 1.710 0.073904 296.0
Station34 Station35 Station36 \
QOSIM1 QOMEAS QOSIM1 QOMEAS QOSIM1 QOMEAS
2006-01 241.2005 579.0 371.3281 NaN 4.953594 541.0
2006-02 238.5152 595.0 374.7190 NaN 4.254171 561.0
2006-03 167.8219 537.0 303.5703 3.27 3.581441 739.0
2006-04 144.5290 357.0 413.3417 48.50 17.389250 1480.0
2006-05 140.9010 397.0 353.7651 101.00 171.000500 1020.0
... ... ... ... ... ... ...
2016-08 193.5179 681.0 440.1571 12.00 0.881175 869.0
2016-09 175.7477 426.0 407.2981 10.30 2.432192 798.0
2016-10 149.3580 554.0 482.3840 46.30 74.663800 1130.0
2016-11 188.1415 427.0 351.9905 NaN 1.182578 870.0
2016-12 224.0186 415.0 349.6316 NaN 0.789295 597.0
QOSIM1
2006-01 427.5667
2006-02 415.8178
2006-03 335.4118
2006-04 1099.3450
2006-05 389.7400
... ...
2016-08 497.6891
2016-09 515.2455
2016-10 1142.1540
2016-11 411.4217
2016-12 379.1852
[132 rows x 72 columns]
DF_YEARLY:
Station1 Station2 Station3 \
QOMEAS QOSIM1 QOMEAS QOSIM1 QOMEAS QOSIM1
2006-01 497.6 255.000989 43.570 29.354184 1258.0 514.910190
2006-02 443.7 219.431940 44.000 25.620279 1119.9 434.235590
2006-03 496.1 237.330074 61.690 29.456879 1372.5 443.272410
2006-04 946.0 700.514210 127.620 187.135294 2393.8 2352.799930
2006-05 2953.2 2605.442050 66.220 31.819423 4389.1 6843.438000
... ... ... ... ... ... ...
2016-08 750.2 927.475750 78.420 74.594729 1011.6 2128.041680
2016-09 724.8 422.331528 49.540 33.929144 954.1 1404.719080
2016-10 862.5 302.145251 28.747 35.848234 2147.5 578.239821
2016-11 844.9 248.927414 27.598 25.503210 2937.1 522.914403
2016-12 283.6 22.069174 25.559 16.063505 861.2 224.814594
Station4 Station5 ... Station32 \
QOMEAS QOSIM1 QOMEAS QOSIM1 ... QOMEAS QOSIM1
2006-01 1510.1 551.567610 3934.2 2200.09614 ... 20.175 0.590106
2006-02 1004.7 464.075780 2989.3 1854.20056 ... 18.251 0.478300
2006-03 1430.7 477.824240 4021.6 1626.21370 ... 64.092 0.493316
2006-04 2575.4 2159.332910 5914.0 3534.92580 ... 41.209 7.669961
2006-05 4667.6 6839.660600 7377.0 7957.81510 ... 18.873 0.888430
... ... ... ... ... ... ... ...
2016-08 1328.6 2922.311840 4895.0 4762.53600 ... 54.050 3.482554
2016-09 1222.4 1834.097930 3251.0 2745.28628 ... 31.562 17.989025
2016-10 2340.5 707.118240 4761.4 1779.08878 ... 150.280 102.764697
2016-11 3233.2 578.021660 5329.0 1641.32825 ... 132.745 5.079822
2016-12 978.8 255.804278 2728.8 1235.42806 ... 61.590 4.169835
Station33 Station34 Station35 \
QOMEAS QOSIM1 QOMEAS QOSIM1 QOMEAS QOSIM1
2006-01 10338.0 7894.0212 14134.0 11653.9629 0.00 171.286128
2006-02 10774.0 7280.9743 14301.0 10693.8007 0.00 127.446174
2006-03 10658.0 5914.0603 15845.0 10844.6710 95.45 121.619349
2006-04 6984.0 4548.2678 21876.0 23652.9112 1278.90 3883.428374
2006-05 7490.0 3851.0856 15437.0 8329.1613 1206.40 831.576470
... ... ... ... ... ... ...
2016-08 2639.7 5094.2190 13493.0 13745.1473 508.46 142.064555
2016-09 2591.8 5544.7912 14801.0 15614.7381 275.94 110.984843
2016-10 5173.0 5621.4511 13602.0 12406.7382 893.16 815.240687
2016-11 7619.0 5938.1749 12559.0 12112.5341 0.00 673.058710
2016-12 8099.0 7111.9885 11070.0 11069.3771 0.00 27.491867
Station36
QOMEAS QOSIM1
2006-01 17081.0 13317.0584
2006-02 15234.0 11846.7382
2006-03 19275.0 12160.7763
2006-04 41014.0 50941.7805
2006-05 38180.0 14260.0252
... ... ...
2016-08 25950.0 18218.1338
2016-09 27273.0 18738.3397
2016-10 29985.0 23319.0566
2016-11 33676.0 19214.4244
2016-12 22216.0 12107.1057
[132 rows x 72 columns]
DF_CUSTOM:
Station1 Station2 Station3 \
QOMEAS QOSIM1 QOMEAS QOSIM1 QOMEAS QOSIM1
2006-05-01 50.9 171.68730 2.51 0.996266 65.0 373.66420
2006-05-02 74.7 68.63315 2.41 1.044244 75.6 233.00150
2006-05-03 84.0 85.91036 1.97 1.077264 99.2 178.93060
2006-05-04 73.0 92.48532 1.89 1.091654 107.0 185.65650
2006-05-05 57.4 92.18147 1.83 1.095437 97.5 181.41870
... ... ... ... ... ... ...
2010-08-26 23.3 30.65498 2.19 1.303906 60.4 86.16090
2010-08-27 23.4 30.63515 2.15 1.286567 57.9 85.91839
2010-08-28 23.4 30.61551 2.09 1.096397 48.0 85.73956
2010-08-29 23.4 30.82702 2.23 0.628180 46.8 85.35615
2010-08-30 23.3 30.71293 2.38 0.854929 49.8 85.37677
Station4 Station5 ... Station32 \
QOMEAS QOSIM1 QOMEAS QOSIM1 ... QOMEAS QOSIM1
2006-05-01 73.5 130.56310 112.0 109.8733 ... 0.516 0.034649
2006-05-02 72.3 281.92170 103.0 136.5076 ... 0.583 0.017460
2006-05-03 79.1 304.97000 103.0 270.7759 ... 0.568 0.011723
2006-05-04 107.0 207.45210 111.0 337.1413 ... 0.586 0.011088
2006-05-05 117.0 185.00960 155.0 260.3247 ... 0.610 0.016608
... ... ... ... ... ... ... ...
2010-08-26 66.9 100.78450 130.0 128.6853 ... 0.689 0.379117
2010-08-27 66.8 100.15130 131.0 127.6567 ... 0.618 0.319645
2010-08-28 66.0 99.50177 131.0 126.1534 ... 0.595 0.193443
2010-08-29 61.4 99.15806 128.0 124.0721 ... 0.597 0.054832
2010-08-30 58.3 98.93661 121.0 121.9650 ... 0.634 0.024951
Station33 Station34 Station35 \
QOMEAS QOSIM1 QOMEAS QOSIM1 QOMEAS QOSIM1
2006-05-01 226.0 145.5417 498.0 291.7991 47.20 15.293560
2006-05-02 229.0 145.7413 521.0 286.1383 47.40 15.254930
2006-05-03 251.0 137.9300 474.0 299.7089 49.90 41.365560
2006-05-04 259.0 124.1504 594.0 311.0887 48.90 37.852760
2006-05-05 283.0 115.4234 721.0 323.5942 45.70 29.140450
... ... ... ... ... ... ...
2010-08-26 251.0 242.9064 540.0 431.6313 11.00 2.328905
2010-08-27 252.0 241.9620 577.0 431.0633 10.00 2.039790
2010-08-28 259.0 241.1594 451.0 422.8851 8.92 1.814524
2010-08-29 262.0 240.2711 458.0 418.0875 7.88 1.636765
2010-08-30 250.0 238.7983 566.0 416.7859 7.21 1.494843
Station36
QOMEAS QOSIM1
2006-05-01 1450.0 999.4495
2006-05-02 1430.0 912.6768
2006-05-03 1410.0 812.4197
2006-05-04 1400.0 675.0276
2006-05-05 1380.0 605.0728
... ... ...
2010-08-26 801.0 474.9331
2010-08-27 820.0 482.8227
2010-08-28 816.0 489.4546
2010-08-29 797.0 485.6065
2010-08-30 786.0 476.1139
[610 rows x 72 columns]
LONG_TERM_MIN:
Station1 Station2 Station3 Station4 \
QOMEAS QOSIM1 QOMEAS QOSIM1 QOMEAS QOSIM1 QOMEAS
jday
1 6.39 7.139231 1.010 0.605778 12.6 12.241200 14.2
2 6.45 6.811264 1.030 0.601963 12.8 12.056260 14.7
3 6.45 6.754036 0.984 0.598170 13.1 11.714360 14.9
4 6.45 6.743594 0.990 0.594399 12.7 11.433930 14.9
5 6.45 6.741405 0.970 0.590652 12.5 11.321270 14.8
... ... ... ... ... ... ... ...
362 6.30 0.655629 0.966 0.528861 11.9 7.048034 13.5
363 6.42 0.652242 1.010 0.534474 12.3 7.042959 13.2
364 6.39 0.648954 1.030 0.539484 12.8 7.037765 13.3
365 6.36 0.645164 1.000 0.543866 12.1 7.032383 14.3
366 6.32 0.642502 1.010 0.547652 14.6 7.026749 14.7
Station5 ... Station32 Station33 \
QOSIM1 QOMEAS QOSIM1 ... QOMEAS QOSIM1 QOMEAS
jday ...
1 12.882790 62.3 36.68124 ... 0.184 0.006802 222.0
2 12.772150 62.8 36.41800 ... 0.207 0.006723 209.0
3 12.707460 59.7 36.17578 ... 0.201 0.006648 209.0
4 12.663210 58.7 35.96361 ... 0.164 0.006575 210.0
5 12.603500 61.5 35.78255 ... 0.186 0.006504 208.0
... ... ... ... ... ... ... ...
362 7.151505 61.1 34.76269 ... 0.162 0.007140 150.0
363 7.145447 60.2 34.57685 ... 0.135 0.007051 171.0
364 7.139501 62.3 34.38791 ... 0.160 0.006965 201.0
365 7.133636 61.7 34.19665 ... 0.209 0.006882 203.0
366 7.127830 68.3 34.00348 ... 0.221 0.011802 244.0
Station34 Station35 Station36
QOSIM1 QOMEAS QOSIM1 QOMEAS QOSIM1 QOMEAS QOSIM1
jday
1 223.7462 186.0 268.4409 NaN 0.219199 232.0 342.2900
2 225.2650 174.0 250.8209 NaN 0.219115 232.0 341.4603
3 232.7867 176.0 251.8573 NaN 0.219035 233.0 337.5074
4 238.1911 221.0 254.7595 NaN 0.218954 235.0 313.5489
5 239.5215 294.0 272.2407 NaN 0.218867 237.0 280.0591
... ... ... ... ... ... ... ...
362 223.4322 238.0 338.4435 NaN 0.219646 235.0 341.6493
363 223.0046 185.0 338.1345 NaN 0.219517 233.0 342.0449
364 222.7246 192.0 336.5176 NaN 0.219399 233.0 341.8484
365 222.7773 203.0 335.9165 NaN 0.219294 233.0 341.9353
366 224.0186 184.0 348.0457 NaN 0.334866 233.0 357.3650
[366 rows x 72 columns]
LONG_TERM_MAX:
Station1 Station2 Station3 Station4 \
QOMEAS QOSIM1 QOMEAS QOSIM1 QOMEAS QOSIM1 QOMEAS
jday
1 26.8 8.251542 2.77 1.524400 41.3 20.44582 52.3
2 26.7 8.268182 2.64 1.516831 41.9 19.96352 53.0
3 26.9 8.268285 2.28 1.511559 42.1 19.23450 53.3
4 26.9 8.265919 2.27 1.511824 42.4 19.04424 54.5
5 26.9 8.263036 2.36 1.524410 43.1 19.00539 54.1
... ... ... ... ... ... ... ...
362 26.8 8.061242 2.57 1.566936 30.8 20.64203 32.5
363 26.8 8.055218 2.50 1.555832 29.0 20.59233 31.4
364 26.8 8.049232 2.74 1.544857 30.8 20.54293 29.3
365 26.8 8.043264 2.08 1.534160 33.0 20.49360 29.4
366 10.8 7.747318 1.92 0.944243 37.7 15.69157 27.2
Station5 ... Station32 Station33 \
QOSIM1 QOMEAS QOSIM1 ... QOMEAS QOSIM1 QOMEAS
jday ...
1 21.48075 144.0 81.22303 ... 1.300 0.175319 303.0
2 21.43509 147.0 81.08855 ... 1.270 0.174007 313.0
3 21.38985 145.0 80.95615 ... 1.150 0.172714 315.0
4 21.31926 146.0 80.80463 ... 1.120 0.171438 329.0
5 21.10353 147.0 80.18205 ... 0.984 0.170179 317.0
... ... ... ... ... ... ... ...
362 21.67048 87.6 81.75812 ... 1.650 0.180753 300.0
363 21.62246 88.9 81.62478 ... 1.670 0.179366 300.0
364 21.57469 94.8 81.49139 ... 1.700 0.177998 300.0
365 21.52737 96.7 81.35756 ... 1.800 0.176649 304.0
366 16.26076 85.0 56.99918 ... 1.710 0.073904 296.0
Station34 Station35 Station36
QOSIM1 QOMEAS QOSIM1 QOMEAS QOSIM1 QOMEAS QOSIM1
jday
1 243.9071 510.0 280.9651 NaN 6.080291 580.0 458.8904
2 246.0166 494.0 255.3430 NaN 6.043128 577.0 457.1690
3 263.2702 472.0 287.3772 NaN 6.003728 574.0 445.3347
4 275.0443 490.0 318.6789 NaN 5.961734 570.0 390.2301
5 275.7499 569.0 341.7578 NaN 5.921951 565.0 336.3000
... ... ... ... ... ... ... ...
362 244.0875 434.0 399.0710 NaN 2.279131 646.0 411.0096
363 243.3286 425.0 396.3768 NaN 2.267446 628.0 411.8364
364 242.1658 494.0 394.7267 NaN 2.255939 615.0 411.8303
365 241.8641 495.0 391.4097 NaN 2.244504 603.0 410.4148
366 229.7141 415.0 384.4842 NaN 0.789295 597.0 396.9688
[366 rows x 72 columns]
LONG_TERM_MEDIAN:
Station1 Station2 Station3 Station4 \
QOMEAS QOSIM1 QOMEAS QOSIM1 QOMEAS QOSIM1 QOMEAS
jday
1 9.00 7.574007 1.44 0.950668 21.4 15.19819 25.4
2 8.99 7.479002 1.46 0.955941 20.6 14.90612 23.8
3 9.01 7.458900 1.44 0.960607 18.3 14.44986 22.1
4 9.03 7.451136 1.53 0.964515 19.6 14.24045 21.3
5 9.06 7.445426 1.51 0.962528 19.5 14.19060 23.2
... ... ... ... ... ... ... ...
362 8.80 7.692451 1.30 0.945497 20.7 14.85478 21.7
363 8.74 7.690284 1.34 0.933742 20.3 14.83068 22.6
364 8.70 7.688163 1.42 0.929169 19.5 14.80670 23.1
365 8.69 7.686083 1.54 0.935499 19.8 14.78280 24.1
366 8.61 7.605867 1.22 0.867881 25.1 14.58051 25.8
Station5 ... Station32 Station33 \
QOSIM1 QOMEAS QOSIM1 ... QOMEAS QOSIM1 QOMEAS
jday ...
1 15.89087 80.0 51.63991 ... 0.485 0.013681 247.0
2 15.86760 78.0 51.20120 ... 0.500 0.013576 247.0
3 15.84433 76.4 50.94381 ... 0.504 0.013478 247.0
4 15.80896 79.0 50.72528 ... 0.305 0.013386 247.0
5 15.71270 80.6 50.53224 ... 0.487 0.013299 247.0
... ... ... ... ... ... ... ...
362 15.08812 80.8 52.63409 ... 0.543 0.014442 247.0
363 15.06748 81.0 52.38522 ... 0.596 0.014146 241.0
364 15.04713 85.9 52.10855 ... 0.716 0.013911 234.0
365 15.02705 84.2 51.80764 ... 0.750 0.013792 251.0
366 14.88280 83.5 42.98656 ... 0.543 0.021806 288.0
Station34 Station35 Station36
QOSIM1 QOMEAS QOSIM1 QOMEAS QOSIM1 QOMEAS QOSIM1
jday
1 228.8185 346.0 275.3788 NaN 0.628797 389.0 379.0888
2 229.2393 358.0 254.0947 NaN 0.625451 384.0 379.0011
3 238.8437 371.0 255.5462 NaN 0.622218 390.0 374.1664
4 246.5980 372.0 278.5749 NaN 0.619057 395.0 339.4591
5 247.5860 411.0 302.3437 NaN 0.615910 394.0 292.4359
... ... ... ... ... ... ... ...
362 230.2822 296.0 361.1377 NaN 0.642829 403.0 382.3588
363 230.2680 284.0 360.6638 NaN 0.639264 403.0 381.3967
364 229.3687 274.0 357.9292 NaN 0.635741 402.0 380.3037
365 228.4871 324.0 359.7653 NaN 0.632243 402.0 379.8543
366 227.4222 411.0 349.6316 NaN 0.526121 403.0 379.1852
[366 rows x 72 columns]
LONG_TERM_Q33.33:
Station1 Station2 Station3 Station4 \
QOMEAS QOSIM1 QOMEAS QOSIM1 QOMEAS QOSIM1 QOMEAS
jday
1 8.546450 7.492825 1.363330 0.927110 15.4996 14.598989 21.49970
2 8.549800 7.321058 1.303290 0.923990 15.6663 14.267958 21.09970
3 8.519810 7.288566 1.233310 0.920834 15.9664 13.571842 19.63300
4 8.489820 7.279251 1.273320 0.917795 17.0999 13.237715 19.46590
5 8.673280 7.273838 1.336660 0.916029 15.3988 13.142147 20.46650
... ... ... ... ... ... ... ...
362 8.386550 7.588589 1.149970 0.925611 16.4987 14.424376 19.89930
363 8.379870 7.588032 1.279990 0.923168 16.8986 14.411325 19.59990
364 8.389880 7.587495 1.366640 0.922142 16.5652 14.398324 20.29980
365 8.379870 7.586959 1.386660 0.921523 15.7991 14.385440 21.36580
366 7.846514 5.284281 1.149986 0.761117 21.5993 12.062086 22.09926
Station5 ... Station32 Station33 \
QOSIM1 QOMEAS QOSIM1 ... QOMEAS QOSIM1 QOMEAS
jday ...
1 14.910385 76.23260 49.485422 ... 0.357664 0.012305 244.3330
2 14.890151 76.93310 49.223239 ... 0.400663 0.012065 243.0000
3 14.869574 75.46640 48.945329 ... 0.291641 0.011839 229.9930
4 14.837230 74.83160 48.697254 ... 0.282329 0.011626 239.9980
5 14.747045 73.33100 48.469181 ... 0.344322 0.011426 242.3310
... ... ... ... ... ... ... ...
362 14.859479 74.23310 48.938420 ... 0.323919 0.013500 223.3330
363 14.850225 75.03120 48.592792 ... 0.313250 0.013210 229.6660
364 14.841335 74.39970 48.289222 ... 0.319920 0.012922 221.6620
365 14.832554 73.39810 47.999614 ... 0.324925 0.012616 228.3230
366 12.297293 78.43232 39.991601 ... 0.435645 0.018471 273.3304
Station34 Station35 Station36 \
QOSIM1 QOMEAS QOSIM1 QOMEAS QOSIM1 QOMEAS
jday
1 226.389087 267.6420 272.311864 NaN 0.546281 378.663
2 226.828302 302.6620 253.681141 NaN 0.544589 376.664
3 234.870904 366.3310 254.345850 NaN 0.542900 377.330
4 241.558765 344.9980 274.893734 NaN 0.541191 379.998
5 242.727515 405.6660 297.636344 NaN 0.539469 383.333
... ... ... ... ... ... ...
362 228.995956 282.9990 356.094449 NaN 0.554486 384.992
363 227.951705 217.9940 355.392135 NaN 0.552613 383.326
364 227.818663 248.9900 355.607096 NaN 0.550778 381.994
365 227.180063 276.3310 352.761145 NaN 0.548956 380.328
366 226.287440 335.3182 349.102861 NaN 0.462356 346.322
QOSIM1
jday
1 371.153060
2 369.620191
3 364.746825
4 331.460081
5 289.166586
... ...
362 371.894527
363 372.053574
364 371.664880
365 371.555069
366 371.910345
[366 rows x 72 columns]
LONG_TERM_Q75:
Station1 Station2 Station3 Station4 \
QOMEAS QOSIM1 QOMEAS QOSIM1 QOMEAS QOSIM1 QOMEAS
jday
1 11.050 7.843863 1.770 1.155343 27.30 18.281285 27.85
2 11.050 7.828401 1.840 1.148879 24.35 17.834545 25.65
3 11.100 7.821506 1.910 1.145031 23.40 17.225050 26.35
4 11.100 7.816033 1.940 1.144586 22.80 16.981345 28.85
5 11.100 7.810806 2.070 1.148610 22.45 16.942345 29.80
... ... ... ... ... ... ... ...
362 10.005 7.806169 1.575 1.147767 22.30 17.158635 26.60
363 10.000 7.804047 1.675 1.151574 23.65 17.114795 26.90
364 10.065 7.801950 1.725 1.159607 25.05 17.071195 27.55
365 10.070 7.799881 1.855 1.161156 24.70 17.027665 26.40
366 9.705 7.676592 1.570 0.906062 31.40 15.136040 26.50
Station5 ... Station32 Station33 \
QOSIM1 QOMEAS QOSIM1 ... QOMEAS QOSIM1 QOMEAS
jday ...
1 19.213765 85.00 60.359625 ... 0.9225 0.021590 281.0
2 19.175245 82.75 60.073970 ... 1.0400 0.021230 278.0
3 19.135435 77.85 59.804710 ... 0.8115 0.021073 266.5
4 19.066915 85.00 59.549385 ... 0.5885 0.020924 272.0
5 18.877095 93.45 59.306935 ... 0.6080 0.020783 281.0
... ... ... ... ... ... ... ...
362 17.873845 82.60 58.483615 ... 1.2450 0.027474 275.0
363 17.842125 85.15 58.199595 ... 1.1950 0.026831 286.5
364 17.810450 88.80 57.911110 ... 1.3900 0.026221 285.0
365 17.770470 90.95 57.620290 ... 1.3100 0.025641 281.5
366 15.571780 84.25 49.992870 ... 1.1265 0.047855 292.0
Station34 Station35 Station36
QOSIM1 QOMEAS QOSIM1 QOMEAS QOSIM1 QOMEAS QOSIM1
jday
1 236.40515 405.0 278.95825 NaN 0.759051 419.5 401.10880
2 237.89070 424.5 254.35925 NaN 0.756100 418.0 399.10420
3 251.92560 420.5 273.32135 NaN 0.752961 415.5 390.29845
4 262.92435 434.5 304.18775 NaN 0.749668 415.0 345.22600
5 263.78620 446.0 325.08600 NaN 0.746377 425.0 296.88195
... ... ... ... ... ... ... ...
362 234.68790 319.5 384.47635 NaN 0.727972 437.0 389.73420
363 234.26900 335.5 383.18980 NaN 0.724931 433.5 392.82560
364 233.78605 370.5 381.87925 NaN 0.721901 423.5 394.29295
365 232.57275 414.0 379.77130 NaN 0.718813 419.5 393.36445
366 228.56815 413.0 367.05790 NaN 0.657708 500.0 388.07700
[366 rows x 72 columns]
LONG_TERM_Q25:
Station1 Station2 Station3 Station4 \
QOMEAS QOSIM1 QOMEAS QOSIM1 QOMEAS QOSIM1 QOMEAS
jday
1 8.115 7.413500 1.305 0.922552 14.70 14.387990 18.20
2 8.125 7.137668 1.255 0.920237 14.65 14.092345 18.10
3 8.020 7.088547 1.165 0.916017 14.95 13.464375 17.45
4 8.195 7.077545 1.255 0.912310 15.55 13.060320 17.10
5 8.465 7.073066 1.265 0.909964 14.05 12.937250 17.80
... ... ... ... ... ... ... ...
362 7.945 7.577808 1.115 0.898338 15.20 14.020995 17.35
363 7.920 7.577145 1.210 0.895366 15.35 14.015170 17.65
364 7.925 7.576450 1.300 0.895148 14.60 14.009405 17.85
365 7.920 7.575757 1.335 0.894539 14.85 14.003725 17.95
366 7.465 4.124185 1.115 0.707767 19.85 10.803629 20.25
Station5 ... Station32 Station33 \
QOSIM1 QOMEAS QOSIM1 ... QOMEAS QOSIM1 QOMEAS
jday ...
1 14.828075 74.95 47.864020 ... 0.3080 0.011636 239.0
2 14.816055 76.60 47.340420 ... 0.3235 0.011369 241.5
3 14.803245 73.45 46.438190 ... 0.2530 0.011116 222.5
4 14.779155 69.10 45.281475 ... 0.2565 0.010920 233.5
5 14.693000 68.90 44.755665 ... 0.2765 0.010756 239.5
... ... ... ... ... ... ... ...
362 14.450355 73.50 46.345625 ... 0.2315 0.013043 219.0
363 14.422705 72.50 46.019035 ... 0.2220 0.012703 222.5
364 14.419420 73.50 45.723430 ... 0.2255 0.012381 215.5
365 14.416185 71.15 45.438295 ... 0.2410 0.012076 216.0
366 11.005315 75.90 38.495020 ... 0.3820 0.016804 266.0
Station34 Station35 Station36
QOSIM1 QOMEAS QOSIM1 QOMEAS QOSIM1 QOMEAS QOSIM1
jday
1 226.29435 235.5 272.11745 NaN 0.429428 369.5 367.27240
2 226.62550 266.5 253.53950 NaN 0.428310 371.5 365.73005
3 234.46340 344.0 253.89820 NaN 0.427138 374.0 359.90450
4 241.37030 342.0 273.28450 NaN 0.425924 375.5 327.36615
5 242.43740 376.5 297.22675 NaN 0.424689 378.0 285.76665
... ... ... ... ... ... ... ...
362 227.83590 265.0 353.77670 NaN 0.435203 367.5 368.61150
363 227.32850 211.0 353.62660 NaN 0.433941 364.0 368.57610
364 226.76740 236.0 354.44465 NaN 0.432741 365.5 368.21680
365 226.21085 255.5 351.51735 NaN 0.431591 367.5 367.93760
366 225.72040 297.5 348.83865 NaN 0.430493 318.0 368.27510
[366 rows x 72 columns]
LONG_TERM_Q33:
Station1 Station2 Station3 Station4 \
QOMEAS QOSIM1 QOMEAS QOSIM1 QOMEAS QOSIM1 QOMEAS
jday
1 8.5250 7.491193 1.3630 0.926739 15.46 14.592321 21.470
2 8.5300 7.314329 1.2990 0.923815 15.63 14.261129 21.070
3 8.5010 7.280980 1.2310 0.920742 15.94 13.564470 19.600
4 8.4720 7.271517 1.2720 0.917687 17.09 13.234946 19.390
5 8.6680 7.266076 1.3360 0.915925 15.28 13.141183 20.450
... ... ... ... ... ... ... ...
362 8.3750 7.587560 1.1470 0.925006 16.37 14.411790 19.830
363 8.3670 7.587020 1.2790 0.922743 16.76 14.399314 19.590
364 8.3780 7.586499 1.3640 0.921981 16.42 14.386888 20.280
365 8.3670 7.585980 1.3860 0.921268 15.71 14.374581 21.280
366 7.8314 5.238323 1.1486 0.759003 21.53 12.012231 22.026
Station5 ... Station32 Station33 \
QOSIM1 QOMEAS QOSIM1 ... QOMEAS QOSIM1 QOMEAS
jday ...
1 14.905590 76.160 49.385928 ... 0.35740 0.012252 244.30
2 14.885311 76.910 49.127803 ... 0.40030 0.012011 243.00
3 14.864676 75.440 48.856151 ... 0.28910 0.011784 229.30
4 14.832275 74.660 48.612151 ... 0.28190 0.011571 239.80
5 14.742554 73.100 48.386444 ... 0.34320 0.011369 242.10
... ... ... ... ... ... ... ...
362 14.854081 74.210 48.915988 ... 0.31590 0.013466 223.30
363 14.845450 74.820 48.564659 ... 0.30500 0.013169 229.60
364 14.837188 74.370 48.257371 ... 0.31200 0.012875 221.20
365 14.829028 73.210 47.964652 ... 0.31750 0.012566 227.30
366 12.246110 78.332 39.932313 ... 0.43352 0.018405 273.04
Station34 Station35 Station36 \
QOSIM1 QOMEAS QOSIM1 QOMEAS QOSIM1 QOMEAS
jday
1 226.387770 265.20 272.295050 NaN 0.544150 378.3
2 226.812010 302.20 253.678610 NaN 0.542499 376.4
3 234.844880 366.10 254.304610 NaN 0.540849 377.0
4 241.555260 344.80 274.788230 NaN 0.539177 379.8
5 242.709160 405.60 297.597820 NaN 0.537491 383.3
... ... ... ... ... ... ...
362 228.951980 282.90 355.914550 NaN 0.552258 384.2
363 227.899430 217.40 355.247070 NaN 0.550420 382.6
364 227.775380 248.00 355.580300 NaN 0.548620 381.4
365 227.173150 276.10 352.729300 NaN 0.546834 379.8
366 226.264976 333.82 349.092394 NaN 0.461094 345.2
QOSIM1
jday
1 371.083140
2 369.549960
3 364.650280
4 331.332840
5 289.006840
... ...
362 371.785000
363 371.965180
364 371.610060
365 371.509070
366 371.766332
[366 rows x 72 columns]
DF_STATS:
Station1 Station2 \
MIN MAX MEDIAN Q75 MIN MAX
2006-01-01 8.251542 8.251542 8.251542 8.251542 0.934610 0.934610
2006-01-02 8.268182 8.268182 8.268182 8.268182 0.927514 0.927514
2006-01-03 8.268285 8.268285 8.268285 8.268285 0.922706 0.922706
2006-01-04 8.265919 8.265919 8.265919 8.265919 0.919975 0.919975
2006-01-05 8.263036 8.263036 8.263036 8.263036 0.918143 0.918143
... ... ... ... ... ... ...
2016-12-27 0.655629 0.655629 0.655629 0.655629 0.528861 0.528861
2016-12-28 0.652242 0.652242 0.652242 0.652242 0.534474 0.534474
2016-12-29 0.648954 0.648954 0.648954 0.648954 0.539484 0.539484
2016-12-30 0.645164 0.645164 0.645164 0.645164 0.543866 0.543866
2016-12-31 0.642502 0.642502 0.642502 0.642502 0.547652 0.547652
Station3 ... Station34 \
MEDIAN Q75 MIN MAX ... MEDIAN Q75
2006-01-01 0.934610 0.934610 18.313040 18.313040 ... 279.7522 279.7522
2006-01-02 0.927514 0.927514 17.737730 17.737730 ... 253.4234 253.4234
2006-01-03 0.922706 0.922706 16.954540 16.954540 ... 287.3772 287.3772
2006-01-04 0.919975 0.919975 16.726120 16.726120 ... 318.6789 318.6789
2006-01-05 0.918143 0.918143 16.695080 16.695080 ... 341.7578 341.7578
... ... ... ... ... ... ... ...
2016-12-27 0.528861 0.528861 7.048034 7.048034 ... 353.2743 353.2743
2016-12-28 0.534474 0.534474 7.042959 7.042959 ... 353.3249 353.3249
2016-12-29 0.539484 0.539484 7.037765 7.037765 ... 353.5526 353.5526
2016-12-30 0.543866 0.543866 7.032383 7.032383 ... 350.5949 350.5949
2016-12-31 0.547652 0.547652 7.026749 7.026749 ... 349.6316 349.6316
Station35 Station36 \
MIN MAX MEDIAN Q75 MIN MAX
2006-01-01 6.080291 6.080291 6.080291 6.080291 458.8904 458.8904
2006-01-02 6.043128 6.043128 6.043128 6.043128 457.1690 457.1690
2006-01-03 6.003728 6.003728 6.003728 6.003728 445.3347 445.3347
2006-01-04 5.961734 5.961734 5.961734 5.961734 390.2301 390.2301
2006-01-05 5.921951 5.921951 5.921951 5.921951 336.3000 336.3000
... ... ... ... ... ... ...
2016-12-27 0.802104 0.802104 0.802104 0.802104 382.5126 382.5126
2016-12-28 0.799029 0.799029 0.799029 0.799029 381.3967 381.3967
2016-12-29 0.795955 0.795955 0.795955 0.795955 380.3037 380.3037
2016-12-30 0.792732 0.792732 0.792732 0.792732 379.8543 379.8543
2016-12-31 0.789295 0.789295 0.789295 0.789295 379.1852 379.1852
MEDIAN Q75
2006-01-01 458.8904 458.8904
2006-01-02 457.1690 457.1690
2006-01-03 445.3347 445.3347
2006-01-04 390.2301 390.2301
2006-01-05 336.3000 336.3000
... ... ...
2016-12-27 382.5126 382.5126
2016-12-28 381.3967 381.3967
2016-12-29 380.3037 380.3037
2016-12-30 379.8543 379.8543
2016-12-31 379.1852 379.1852
[4018 rows x 144 columns]
Metrics
This section has 2 broad groups, Model Evaluation (comparison) metrics and model diagonistic (single data) metrics. The model diagonistic metrics are used to inform trends and behaviours as shown by either the measured or simulated data. These are shown below:
[16]:
obs_df = DATAFRAMES['DF_OBSERVED']
sim_df = DATAFRAMES['DF_SIMULATED']
[17]:
# The Time to Peak for the simulated data will look like
print(metrics.time_to_peak(df=sim_df))

# The time to peak for the observed data looks like:-
print(metrics.time_to_peak(df=obs_df))
              ttp
Station 1   163.0
Station 2   185.0
Station 3   165.0
Station 4   165.0
Station 5   170.0
Station 6   199.0
Station 7   158.0
Station 8   173.0
Station 9   160.0
Station 10  163.0
Station 11  162.0
Station 12  166.0
Station 13  167.0
Station 14  166.0
Station 15  186.0
Station 16  173.0
Station 17  175.0
Station 18  176.0
Station 19  168.0
Station 20  167.0
Station 21  170.0
Station 22  167.0
Station 23  130.0
Station 24  142.0
Station 25  141.0
Station 26  168.0
Station 27  137.0
Station 28  141.0
Station 29  145.0
Station 30  167.0
Station 31  160.0
Station 32  142.0
Station 33  197.0
Station 34  173.0
Station 35  144.0
Station 36  132.0
              ttp
Station 1   162.0
Station 2   174.0
Station 3   162.0
Station 4   163.0
Station 5   170.0
Station 6   175.0
Station 7   167.0
Station 8   187.0
Station 9   169.0
Station 10  161.0
Station 11  168.0
Station 12  159.0
Station 13  150.0
Station 14  164.0
Station 15  151.0
Station 16  152.0
Station 17  148.0
Station 18  142.0
Station 19  177.0
Station 20  166.0
Station 21  170.0
Station 22  160.0
Station 23  124.0
Station 24  110.0
Station 25  123.0
Station 26  155.0
Station 27  127.0
Station 28  123.0
Station 29  134.0
Station 30  122.0
Station 31  142.0
Station 32  103.0
Station 33  153.0
Station 34  146.0
Station 35  175.0
Station 36  145.0
[18]:
# The Time to Centre of Mass for the simulated data will look like
print(metrics.time_to_centre_of_mass(df=sim_df))

# The time to Centre of Mass for the observed data looks like:-
print(metrics.time_to_centre_of_mass(df=obs_df))
            ttcom
Station 1   184.0
Station 2   188.0
Station 3   181.0
Station 4   185.0
Station 5   186.0
Station 6   202.0
Station 7   192.0
Station 8   177.0
Station 9   187.0
Station 10  172.0
Station 11  184.0
Station 12  184.0
Station 13  184.0
Station 14  194.0
Station 15  174.0
Station 16  184.0
Station 17  184.0
Station 18  186.0
Station 19  190.0
Station 20  195.0
Station 21  199.0
Station 22  188.0
Station 23  141.0
Station 24  143.0
Station 25  154.0
Station 26  187.0
Station 27  154.0
Station 28  162.0
Station 29  167.0
Station 30  167.0
Station 31  184.0
Station 32  163.0
Station 33  191.0
Station 34  186.0
Station 35  158.0
Station 36  182.0
            ttcom
Station 1   177.0
Station 2   184.0
Station 3   173.0
Station 4   175.0
Station 5   178.0
Station 6     0.0
Station 7   193.0
Station 8   199.0
Station 9   184.0
Station 10  175.0
Station 11    0.0
Station 12    0.0
Station 13  180.0
Station 14  194.0
Station 15  169.0
Station 16  178.0
Station 17  174.0
Station 18  175.0
Station 19  193.0
Station 20    0.0
Station 21    0.0
Station 22  182.0
Station 23    0.0
Station 24    0.0
Station 25    0.0
Station 26    0.0
Station 27  151.0
Station 28    0.0
Station 29    0.0
Station 30  156.0
Station 31  177.0
Station 32  149.0
Station 33  175.0
Station 34  172.0
Station 35    0.0
Station 36  180.0
[19]:
# The Spring Pulse Onset for the simulated data will look like
print(metrics.SpringPulseOnset(df=sim_df))

# The Spring Pulse Onset for the observed data looks like:-
print(metrics.SpringPulseOnset(df=obs_df))
             SPOD
Station
Station 1   126.0
Station 2   120.0
Station 3   119.0
Station 4   122.0
Station 5   121.0
Station 6   136.0
Station 7   125.0
Station 8   119.0
Station 9   132.0
Station 10  105.0
Station 11  117.0
Station 12  124.0
Station 13  124.0
Station 14  131.0
Station 15  120.0
Station 16  137.0
Station 17  135.0
Station 18  134.0
Station 19  123.0
Station 20  114.0
Station 21  138.0
Station 22  115.0
Station 23   98.3
Station 24   83.2
Station 25  104.0
Station 26  114.0
Station 27  111.0
Station 28  107.0
Station 29  107.0
Station 30  108.0
Station 31  110.0
Station 32  128.0
Station 33  178.0
Station 34  127.0
Station 35  101.0
Station 36  106.0
             SPOD
Station
Station 1   113.0
Station 2   108.0
Station 3   111.0
Station 4   114.0
Station 5   115.0
Station 6     NaN
Station 7   134.0
Station 8   170.0
Station 9   134.0
Station 10  112.0
Station 11   55.6
Station 12   66.0
Station 13  147.0
Station 14  137.0
Station 15  113.0
Station 16  115.0
Station 17  108.0
Station 18  109.0
Station 19  142.0
Station 20   61.0
Station 21    NaN
Station 22  116.0
Station 23   55.9
Station 24   44.1
Station 25   34.8
Station 26  115.0
Station 27  113.0
Station 28   55.9
Station 29   38.5
Station 30   93.2
Station 31   95.5
Station 32   90.7
Station 33  192.0
Station 34   98.8
Station 35   68.5
Station 36   99.7
The model comparison metrics are used to directly compare the observed/measured data to the model predictions and to determine how accurate the model is at predicting the streamflow at a particular station. A few of these are shown below:
[20]:
# Mean square error for the data we were given
print(metrics.rmse(observed=obs_df, simulated=sim_df))
             model1
Station 1    38.490
Station 2     3.628
Station 3    74.220
Station 4    74.050
Station 5   118.400
Station 6     8.221
Station 7    26.370
Station 8     8.293
Station 9    48.550
Station 10   24.930
Station 11   73.540
Station 12   74.480
Station 13   67.020
Station 14   21.970
Station 15   10.450
Station 16   36.920
Station 17   51.150
Station 18   60.480
Station 19   23.970
Station 20   92.300
Station 21   29.180
Station 22  107.100
Station 23    7.273
Station 24    3.127
Station 25    8.159
Station 26  128.200
Station 27    4.289
Station 28   10.000
Station 29   13.080
Station 30   13.010
Station 31  151.500
Station 32    6.576
Station 33  164.900
Station 34  292.000
Station 35   60.490
Station 36  453.100
[21]:
# Root Mean square error for the data we were given
print(metrics.nse(observed=obs_df, simulated=sim_df))
              model1
Station 1   0.583300
Station 2  -0.784500
Station 3   0.689300
Station 4   0.687800
Station 5   0.749000
Station 6   0.490100
Station 7   0.604000
Station 8  -0.000706
Station 9   0.532300
Station 10  0.779300
Station 11  0.763700
Station 12  0.764800
Station 13  0.704300
Station 14  0.714800
Station 15  0.317700
Station 16  0.671200
Station 17  0.499800
Station 18  0.403300
Station 19 -0.159300
Station 20 -0.186100
Station 21  0.536700
Station 22  0.499200
Station 23 -1.225000
Station 24 -0.272300
Station 25 -2.729000
Station 26  0.403000
Station 27  0.146100
Station 28  0.047750
Station 29  0.133500
Station 30  0.124100
Station 31  0.376100
Station 32 -0.164700
Station 33  0.306000
Station 34  0.284000
Station 35 -3.524000
Station 36 -0.169600
[22]:
# Mean Average error for the data we were given
print(metrics.kge(observed=obs_df, simulated=sim_df))
            model1
Station 1   0.5204
Station 2   0.1888
Station 3   0.7645
Station 4   0.7871
Station 5   0.7934
Station 6   0.6496
Station 7   0.4837
Station 8   0.4798
Station 9   0.5604
Station 10  0.6156
Station 11  0.7653
Station 12  0.7632
Station 13  0.6993
Station 14  0.8456
Station 15  0.5165
Station 16  0.7587
Station 17  0.6101
Station 18  0.6116
Station 19  0.3055
Station 20  0.2726
Station 21  0.7361
Station 22  0.7028
Station 23  0.1298
Station 24  0.4044
Station 25 -0.2552
Station 26  0.6826
Station 27  0.3307
Station 28  0.2464
Station 29  0.2336
Station 30  0.4044
Station 31  0.6700
Station 32 -0.1087
Station 33  0.5212
Station 34  0.6574
Station 35 -0.4212
Station 36  0.4619
[23]:
# Nash-Sutcliffe Efficiency for the data we were given
print(metrics.lognse(observed=obs_df, simulated=sim_df))
               model1
Station 1    0.542600
Station 2   -0.741000
Station 3    0.402000
Station 4    0.290600
Station 5    0.142000
Station 6    0.009106
Station 7    0.117400
Station 8  -10.930000
Station 9   -0.868700
Station 10  -0.431700
Station 11   0.060580
Station 12   0.264100
Station 13  -0.133000
Station 14   0.571700
Station 15  -3.215000
Station 16   0.604600
Station 17   0.542000
Station 18   0.552700
Station 19  -0.454600
Station 20  -1.006000
Station 21   0.221800
Station 22  -0.311500
Station 23  -0.581800
Station 24  -0.315300
Station 25   0.022060
Station 26  -0.108300
Station 27  -1.341000
Station 28   0.088830
Station 29   0.262300
Station 30   0.392100
Station 31   0.238600
Station 32 -10.750000
Station 33   0.289100
Station 34   0.225400
Station 35  -1.238000
Station 36   0.099630
Naturally, these can all be requested together in a list that returns a single df.
[24]:
metrices = ["RMSE", "KGE", "NSE", "LogNSE", "TTP_OBS", "TTP_SIM",  "TTCOM_OBS", "TTCOM_SIM",  "SPOD_OBS", "SPOD_SIM"]
metrics.calculate_metrics(observed=obs_df, simulated=sim_df, metrices=metrices)
[24]:
| RMSE | KGE | NSE | LOGNSE | TTP_OBS | TTP_SIM_model1 | TTCOM_OBS | TTCOM_SIM_model1 | SPOD_OBS | SPOD_SIM_model1 | |
|---|---|---|---|---|---|---|---|---|---|---|
| model1 | model1 | model1 | model1 | ttp | ttp | ttcom | ttcom | SPOD | SPOD | |
| Station 1 | 38.490 | 0.5204 | 0.583300 | 0.542600 | 162.0 | 163.0 | 177.0 | 184.0 | 113.0 | 126.0 |
| Station 2 | 3.628 | 0.1888 | -0.784500 | -0.741000 | 174.0 | 185.0 | 184.0 | 188.0 | 108.0 | 120.0 |
| Station 3 | 74.220 | 0.7645 | 0.689300 | 0.402000 | 162.0 | 165.0 | 173.0 | 181.0 | 111.0 | 119.0 |
| Station 4 | 74.050 | 0.7871 | 0.687800 | 0.290600 | 163.0 | 165.0 | 175.0 | 185.0 | 114.0 | 122.0 |
| Station 5 | 118.400 | 0.7934 | 0.749000 | 0.142000 | 170.0 | 170.0 | 178.0 | 186.0 | 115.0 | 121.0 |
| Station 6 | 8.221 | 0.6496 | 0.490100 | 0.009106 | 175.0 | 199.0 | 0.0 | 202.0 | NaN | 136.0 |
| Station 7 | 26.370 | 0.4837 | 0.604000 | 0.117400 | 167.0 | 158.0 | 193.0 | 192.0 | 134.0 | 125.0 |
| Station 8 | 8.293 | 0.4798 | -0.000706 | -10.930000 | 187.0 | 173.0 | 199.0 | 177.0 | 170.0 | 119.0 |
| Station 9 | 48.550 | 0.5604 | 0.532300 | -0.868700 | 169.0 | 160.0 | 184.0 | 187.0 | 134.0 | 132.0 |
| Station 10 | 24.930 | 0.6156 | 0.779300 | -0.431700 | 161.0 | 163.0 | 175.0 | 172.0 | 112.0 | 105.0 |
| Station 11 | 73.540 | 0.7653 | 0.763700 | 0.060580 | 168.0 | 162.0 | 0.0 | 184.0 | 55.6 | 117.0 |
| Station 12 | 74.480 | 0.7632 | 0.764800 | 0.264100 | 159.0 | 166.0 | 0.0 | 184.0 | 66.0 | 124.0 |
| Station 13 | 67.020 | 0.6993 | 0.704300 | -0.133000 | 150.0 | 167.0 | 180.0 | 184.0 | 147.0 | 124.0 |
| Station 14 | 21.970 | 0.8456 | 0.714800 | 0.571700 | 164.0 | 166.0 | 194.0 | 194.0 | 137.0 | 131.0 |
| Station 15 | 10.450 | 0.5165 | 0.317700 | -3.215000 | 151.0 | 186.0 | 169.0 | 174.0 | 113.0 | 120.0 |
| Station 16 | 36.920 | 0.7587 | 0.671200 | 0.604600 | 152.0 | 173.0 | 178.0 | 184.0 | 115.0 | 137.0 |
| Station 17 | 51.150 | 0.6101 | 0.499800 | 0.542000 | 148.0 | 175.0 | 174.0 | 184.0 | 108.0 | 135.0 |
| Station 18 | 60.480 | 0.6116 | 0.403300 | 0.552700 | 142.0 | 176.0 | 175.0 | 186.0 | 109.0 | 134.0 |
| Station 19 | 23.970 | 0.3055 | -0.159300 | -0.454600 | 177.0 | 168.0 | 193.0 | 190.0 | 142.0 | 123.0 |
| Station 20 | 92.300 | 0.2726 | -0.186100 | -1.006000 | 166.0 | 167.0 | 0.0 | 195.0 | 61.0 | 114.0 |
| Station 21 | 29.180 | 0.7361 | 0.536700 | 0.221800 | 170.0 | 170.0 | 0.0 | 199.0 | NaN | 138.0 |
| Station 22 | 107.100 | 0.7028 | 0.499200 | -0.311500 | 160.0 | 167.0 | 182.0 | 188.0 | 116.0 | 115.0 |
| Station 23 | 7.273 | 0.1298 | -1.225000 | -0.581800 | 124.0 | 130.0 | 0.0 | 141.0 | 55.9 | 98.3 |
| Station 24 | 3.127 | 0.4044 | -0.272300 | -0.315300 | 110.0 | 142.0 | 0.0 | 143.0 | 44.1 | 83.2 |
| Station 25 | 8.159 | -0.2552 | -2.729000 | 0.022060 | 123.0 | 141.0 | 0.0 | 154.0 | 34.8 | 104.0 |
| Station 26 | 128.200 | 0.6826 | 0.403000 | -0.108300 | 155.0 | 168.0 | 0.0 | 187.0 | 115.0 | 114.0 |
| Station 27 | 4.289 | 0.3307 | 0.146100 | -1.341000 | 127.0 | 137.0 | 151.0 | 154.0 | 113.0 | 111.0 |
| Station 28 | 10.000 | 0.2464 | 0.047750 | 0.088830 | 123.0 | 141.0 | 0.0 | 162.0 | 55.9 | 107.0 |
| Station 29 | 13.080 | 0.2336 | 0.133500 | 0.262300 | 134.0 | 145.0 | 0.0 | 167.0 | 38.5 | 107.0 |
| Station 30 | 13.010 | 0.4044 | 0.124100 | 0.392100 | 122.0 | 167.0 | 156.0 | 167.0 | 93.2 | 108.0 |
| Station 31 | 151.500 | 0.6700 | 0.376100 | 0.238600 | 142.0 | 160.0 | 177.0 | 184.0 | 95.5 | 110.0 |
| Station 32 | 6.576 | -0.1087 | -0.164700 | -10.750000 | 103.0 | 142.0 | 149.0 | 163.0 | 90.7 | 128.0 |
| Station 33 | 164.900 | 0.5212 | 0.306000 | 0.289100 | 153.0 | 197.0 | 175.0 | 191.0 | 192.0 | 178.0 |
| Station 34 | 292.000 | 0.6574 | 0.284000 | 0.225400 | 146.0 | 173.0 | 172.0 | 186.0 | 98.8 | 127.0 |
| Station 35 | 60.490 | -0.4212 | -3.524000 | -1.238000 | 175.0 | 144.0 | 0.0 | 158.0 | 68.5 | 101.0 |
| Station 36 | 453.100 | 0.4619 | -0.169600 | 0.099630 | 145.0 | 132.0 | 180.0 | 182.0 | 99.7 | 106.0 |
You can also request all available metrics for the given data
[25]:
metrics.calculate_all_metrics(observed=DATAFRAMES['DF_OBSERVED'], simulated=DATAFRAMES['DF_SIMULATED'],
#                          format='txt', out='metrics'
                         )
[25]:
| MSE | RMSE | MAE | NSE | NegNSE | LogNSE | NegLogNSE | KGE | NegKGE | KGE 2012 | BIAS | AbsBIAS | TTP_obs | TTCoM_obs | SPOD_obs | TTP_sim_model1 | TTCoM_sim_model1 | SPOD_sim_model1 | |
|---|---|---|---|---|---|---|---|---|---|---|---|---|---|---|---|---|---|---|
| model1 | model1 | model1 | model1 | model1 | model1 | model1 | model1 | model1 | model1 | model1 | model1 | ttp | ttcom | SPOD | ttp | ttcom | SPOD | |
| Station 1 | 1481.000 | 38.490 | 67140.0 | 0.583300 | -0.583300 | 0.542600 | -0.542600 | 0.5204 | -0.5204 | 0.58590 | -34.3800 | 34.3800 | 162.0 | 177.0 | 113.0 | 163.0 | 184.0 | 126.0 |
| Station 2 | 13.160 | 3.628 | 6266.0 | -0.784500 | 0.784500 | -0.741000 | 0.741000 | 0.1888 | -0.1888 | -0.02282 | -30.6500 | 30.6500 | 174.0 | 184.0 | 108.0 | 185.0 | 188.0 | 120.0 |
| Station 3 | 5508.000 | 74.220 | 152900.0 | 0.689300 | -0.689300 | 0.402000 | -0.402000 | 0.7645 | -0.7645 | 0.78530 | -3.7530 | 3.7530 | 162.0 | 173.0 | 111.0 | 165.0 | 181.0 | 119.0 |
| Station 4 | 5484.000 | 74.050 | 171500.0 | 0.687800 | -0.687800 | 0.290600 | -0.290600 | 0.7871 | -0.7871 | 0.75790 | 5.6290 | 5.6290 | 163.0 | 175.0 | 114.0 | 165.0 | 185.0 | 122.0 |
| Station 5 | 14010.000 | 118.400 | 298500.0 | 0.749000 | -0.749000 | 0.142000 | -0.142000 | 0.7934 | -0.7934 | 0.82810 | -11.2300 | 11.2300 | 170.0 | 178.0 | 115.0 | 170.0 | 186.0 | 121.0 |
| Station 6 | 67.580 | 8.221 | 12040.0 | 0.490100 | -0.490100 | 0.009106 | -0.009106 | 0.6496 | -0.6496 | 0.59080 | -28.5200 | 28.5200 | 175.0 | 0.0 | NaN | 199.0 | 202.0 | 136.0 |
| Station 7 | 695.600 | 26.370 | 66730.0 | 0.604000 | -0.604000 | 0.117400 | -0.117400 | 0.4837 | -0.4837 | 0.57750 | -38.6200 | 38.6200 | 167.0 | 193.0 | 134.0 | 158.0 | 192.0 | 125.0 |
| Station 8 | 68.770 | 8.293 | 15450.0 | -0.000706 | 0.000706 | -10.930000 | 10.930000 | 0.4798 | -0.4798 | 0.37790 | -7.7210 | 7.7210 | 187.0 | 199.0 | 170.0 | 173.0 | 177.0 | 119.0 |
| Station 9 | 2357.000 | 48.550 | 138900.0 | 0.532300 | -0.532300 | -0.868700 | 0.868700 | 0.5604 | -0.5604 | 0.57430 | -35.0000 | 35.0000 | 169.0 | 184.0 | 134.0 | 160.0 | 187.0 | 132.0 |
| Station 10 | 621.700 | 24.930 | 46660.0 | 0.779300 | -0.779300 | -0.431700 | 0.431700 | 0.6156 | -0.6156 | 0.58530 | -32.7500 | 32.7500 | 161.0 | 175.0 | 112.0 | 163.0 | 172.0 | 105.0 |
| Station 11 | 5407.000 | 73.540 | 117900.0 | 0.763700 | -0.763700 | 0.060580 | -0.060580 | 0.7653 | -0.7653 | 0.74440 | -19.1100 | 19.1100 | 168.0 | 0.0 | 55.6 | 162.0 | 184.0 | 117.0 |
| Station 12 | 5547.000 | 74.480 | 114700.0 | 0.764800 | -0.764800 | 0.264100 | -0.264100 | 0.7632 | -0.7632 | 0.78300 | -17.1600 | 17.1600 | 159.0 | 0.0 | 66.0 | 166.0 | 184.0 | 124.0 |
| Station 13 | 4492.000 | 67.020 | 162400.0 | 0.704300 | -0.704300 | -0.133000 | 0.133000 | 0.6993 | -0.6993 | 0.68250 | -23.8800 | 23.8800 | 150.0 | 180.0 | 147.0 | 167.0 | 184.0 | 124.0 |
| Station 14 | 482.800 | 21.970 | 37010.0 | 0.714800 | -0.714800 | 0.571700 | -0.571700 | 0.8456 | -0.8456 | 0.85820 | 5.0280 | 5.0280 | 164.0 | 194.0 | 137.0 | 166.0 | 194.0 | 131.0 |
| Station 15 | 109.200 | 10.450 | 17130.0 | 0.317700 | -0.317700 | -3.215000 | 3.215000 | 0.5165 | -0.5165 | 0.19070 | -36.7800 | 36.7800 | 151.0 | 169.0 | 113.0 | 186.0 | 174.0 | 120.0 |
| Station 16 | 1363.000 | 36.920 | 74020.0 | 0.671200 | -0.671200 | 0.604600 | -0.604600 | 0.7587 | -0.7587 | 0.71610 | -17.3600 | 17.3600 | 152.0 | 178.0 | 115.0 | 173.0 | 184.0 | 137.0 |
| Station 17 | 2617.000 | 51.150 | 94840.0 | 0.499800 | -0.499800 | 0.542000 | -0.542000 | 0.6101 | -0.6101 | 0.63610 | -23.5400 | 23.5400 | 148.0 | 174.0 | 108.0 | 175.0 | 184.0 | 135.0 |
| Station 18 | 3657.000 | 60.480 | 111300.0 | 0.403300 | -0.403300 | 0.552700 | -0.552700 | 0.6116 | -0.6116 | 0.60940 | -20.2100 | 20.2100 | 142.0 | 175.0 | 109.0 | 176.0 | 186.0 | 134.0 |
| Station 19 | 574.400 | 23.970 | 42050.0 | -0.159300 | 0.159300 | -0.454600 | 0.454600 | 0.3055 | -0.3055 | 0.30040 | -0.3184 | 0.3184 | 177.0 | 193.0 | 142.0 | 168.0 | 190.0 | 123.0 |
| Station 20 | 8519.000 | 92.300 | 139600.0 | -0.186100 | 0.186100 | -1.006000 | 1.006000 | 0.2726 | -0.2726 | 0.10200 | -9.4830 | 9.4830 | 166.0 | 0.0 | 61.0 | 167.0 | 195.0 | 114.0 |
| Station 21 | 851.600 | 29.180 | 39380.0 | 0.536700 | -0.536700 | 0.221800 | -0.221800 | 0.7361 | -0.7361 | 0.61920 | -16.4800 | 16.4800 | 170.0 | 0.0 | NaN | 170.0 | 199.0 | 138.0 |
| Station 22 | 11460.000 | 107.100 | 271400.0 | 0.499200 | -0.499200 | -0.311500 | 0.311500 | 0.7028 | -0.7028 | 0.53500 | -16.1500 | 16.1500 | 160.0 | 182.0 | 116.0 | 167.0 | 188.0 | 115.0 |
| Station 23 | 52.890 | 7.273 | 7224.0 | -1.225000 | 1.225000 | -0.581800 | 0.581800 | 0.1298 | -0.1298 | 0.19850 | 5.3430 | 5.3430 | 124.0 | 0.0 | 55.9 | 130.0 | 141.0 | 98.3 |
| Station 24 | 9.779 | 3.127 | 2665.0 | -0.272300 | 0.272300 | -0.315300 | 0.315300 | 0.4044 | -0.4044 | 0.41300 | 13.8800 | 13.8800 | 110.0 | 0.0 | 44.1 | 142.0 | 143.0 | 83.2 |
| Station 25 | 66.570 | 8.159 | 6284.0 | -2.729000 | 2.729000 | 0.022060 | -0.022060 | -0.2552 | 0.2552 | -0.40200 | -7.2750 | 7.2750 | 123.0 | 0.0 | 34.8 | 141.0 | 154.0 | 104.0 |
| Station 26 | 16440.000 | 128.200 | 303900.0 | 0.403000 | -0.403000 | -0.108300 | 0.108300 | 0.6826 | -0.6826 | 0.53830 | -17.2000 | 17.2000 | 155.0 | 0.0 | 115.0 | 168.0 | 187.0 | 114.0 |
| Station 27 | 18.400 | 4.289 | 5517.0 | 0.146100 | -0.146100 | -1.341000 | 1.341000 | 0.3307 | -0.3307 | 0.17770 | -44.1000 | 44.1000 | 127.0 | 151.0 | 113.0 | 137.0 | 154.0 | 111.0 |
| Station 28 | 100.000 | 10.000 | 11630.0 | 0.047750 | -0.047750 | 0.088830 | -0.088830 | 0.2464 | -0.2464 | -0.15180 | -54.5500 | 54.5500 | 123.0 | 0.0 | 55.9 | 141.0 | 162.0 | 107.0 |
| Station 29 | 171.100 | 13.080 | 14920.0 | 0.133500 | -0.133500 | 0.262300 | -0.262300 | 0.2336 | -0.2336 | -0.01700 | -55.1100 | 55.1100 | 134.0 | 0.0 | 38.5 | 145.0 | 167.0 | 107.0 |
| Station 30 | 169.400 | 13.010 | 22520.0 | 0.124100 | -0.124100 | 0.392100 | -0.392100 | 0.4044 | -0.4044 | 0.37740 | -31.1100 | 31.1100 | 122.0 | 156.0 | 93.2 | 167.0 | 167.0 | 108.0 |
| Station 31 | 22960.000 | 151.500 | 340000.0 | 0.376100 | -0.376100 | 0.238600 | -0.238600 | 0.6700 | -0.6700 | 0.54770 | -12.3800 | 12.3800 | 142.0 | 177.0 | 95.5 | 160.0 | 184.0 | 110.0 |
| Station 32 | 43.240 | 6.576 | 8702.0 | -0.164700 | 0.164700 | -10.750000 | 10.750000 | -0.1087 | 0.1087 | -0.32950 | -67.2700 | 67.2700 | 103.0 | 149.0 | 90.7 | 142.0 | 163.0 | 128.0 |
| Station 33 | 27180.000 | 164.900 | 352400.0 | 0.306000 | -0.306000 | 0.289100 | -0.289100 | 0.5212 | -0.5212 | 0.55100 | -8.3230 | 8.3230 | 153.0 | 175.0 | 192.0 | 197.0 | 191.0 | 178.0 |
| Station 34 | 85260.000 | 292.000 | 698300.0 | 0.284000 | -0.284000 | 0.225400 | -0.225400 | 0.6574 | -0.6574 | 0.65180 | -2.5850 | 2.5850 | 146.0 | 172.0 | 98.8 | 173.0 | 186.0 | 127.0 |
| Station 35 | 3658.000 | 60.490 | 76340.0 | -3.524000 | 3.524000 | -1.238000 | 1.238000 | -0.4212 | 0.4212 | -0.13450 | 17.7700 | 17.7700 | 175.0 | 0.0 | 68.5 | 144.0 | 158.0 | 101.0 |
| Station 36 | 205300.000 | 453.100 | 1084000.0 | -0.169600 | 0.169600 | 0.099630 | -0.099630 | 0.4619 | -0.4619 | 0.30060 | -12.7300 | 12.7300 | 145.0 | 180.0 | 99.7 | 132.0 | 182.0 | 106.0 |
Visualizations
Being able to simply observe trends and behaviours is huge when it comes to model analysis and diagonistics. That’s what these plotting tools allow us to do.
[26]:
# Specify the Stations of importance.
stations_a = ["05AG006", "05BN012", "05AJ001", "05GG001"]
stations_b = ["05CK004", "05DF001", '05HG001', '05KD003']
[27]:
# A very simple line plot can be generated as shown below
# Just plotting the simulated data from the first station
visuals.plot(
    df = obs_df.loc[:, [f"QOMEAS_{col}" for col in stations_a if f"QOMEAS_{col}" in obs_df.columns]],
    title = [f"{i}: Hydrograph of the Measured Data" for i in stations_a],
    grid=True,
)
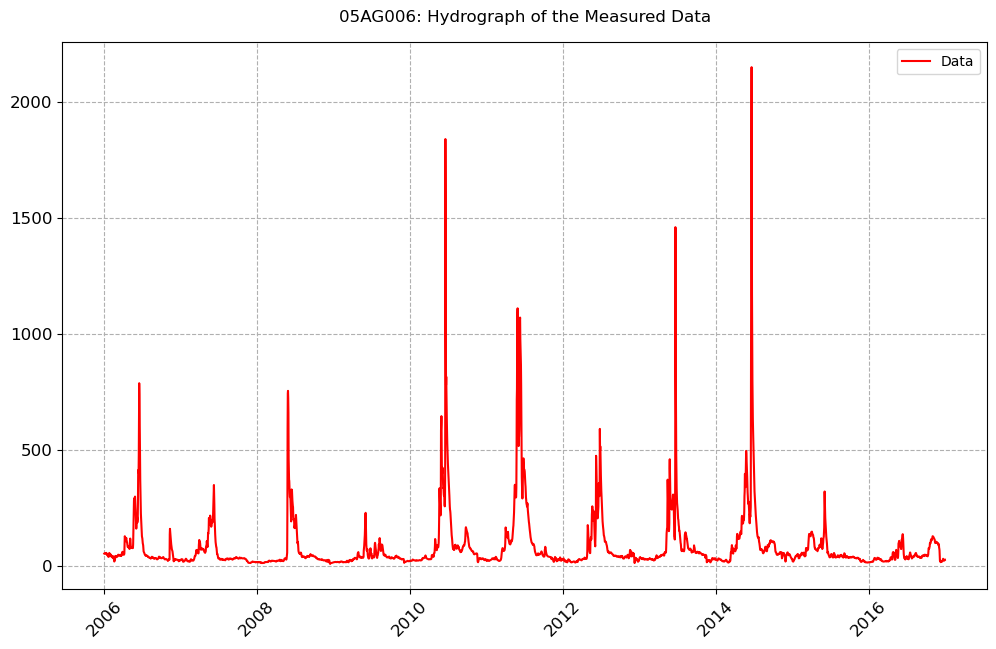
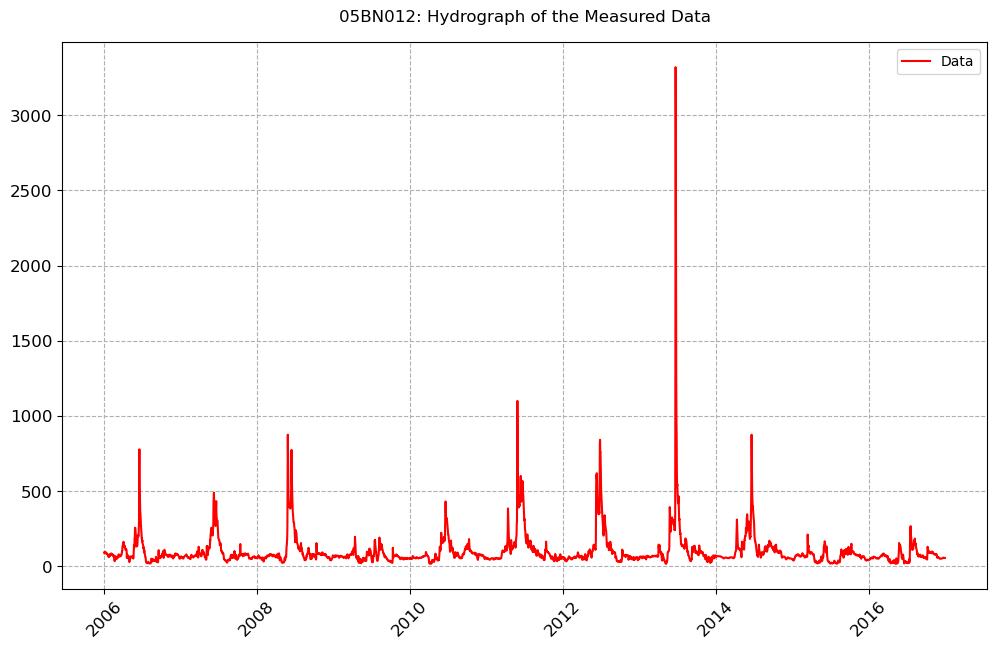
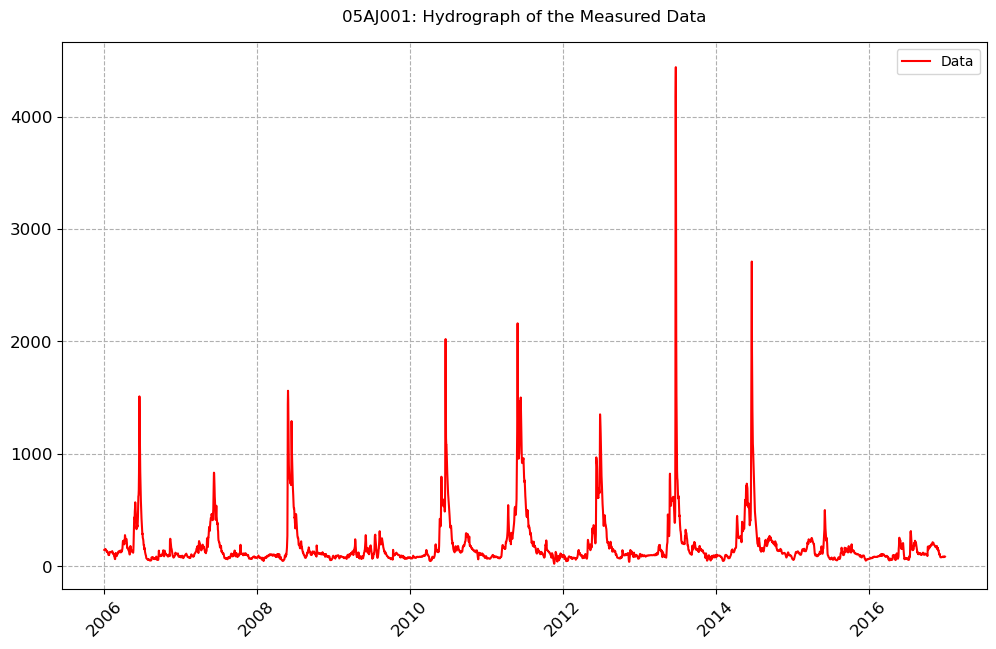
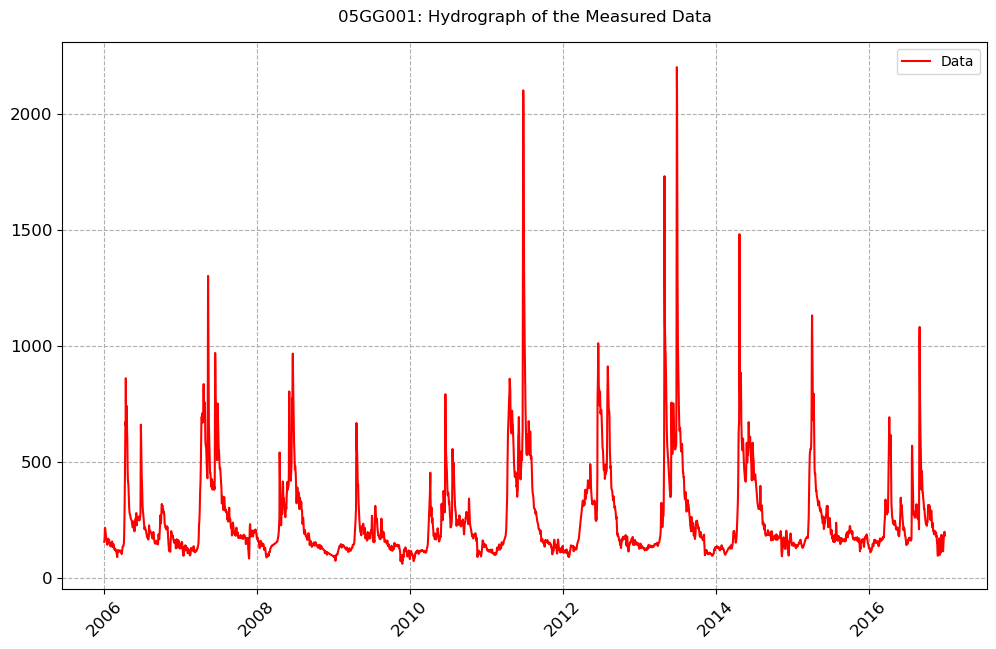
[28]:
# Plotting both Observed and Simulated combined
visuals.plot(
    merged_df = merged_df.loc[:, [col for col in stations_b if col in merged_df.columns]],
    title = [f"{i}: Hydrograph - OBSERVED vs SIMULATED" for i in stations_b],
    grid=True,
)
Number of simulated data columns: 1
Number of linewidths provided is less than the number of columns. Number of columns : 2. Number of linewidths provided is:  1. Defaulting to 1.5
Number of linestyles provided is less than the number of columns. Number of columns : 2. Number of linestyles provided is:  1. Defaulting to solid lines (-)
Number of legends provided is less than the number of columns. Number of columns : 2. Number of legends provided is:  1. Applying Default legend names
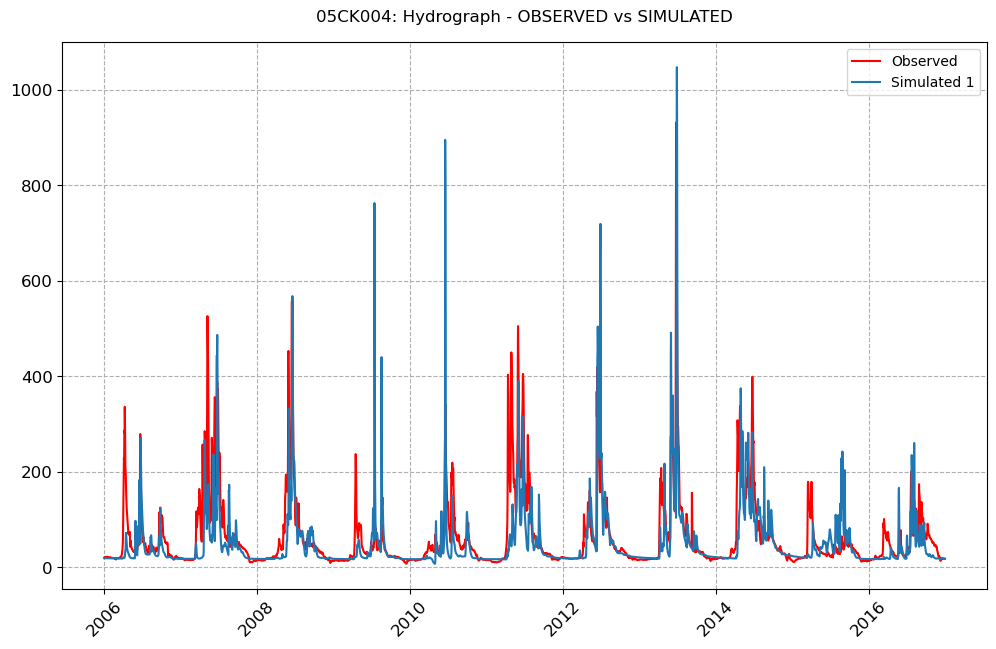
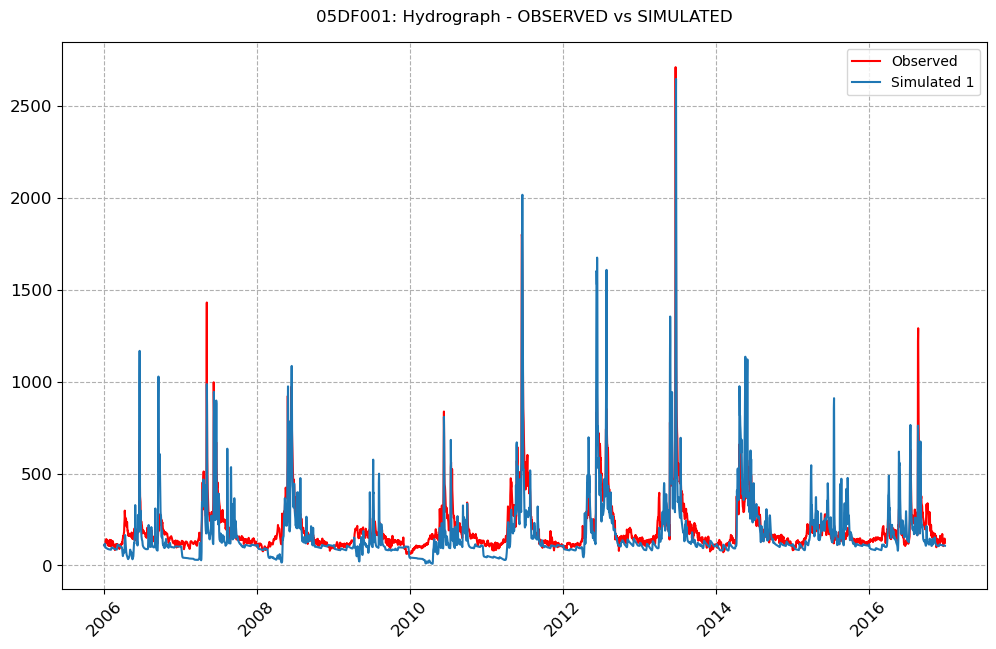
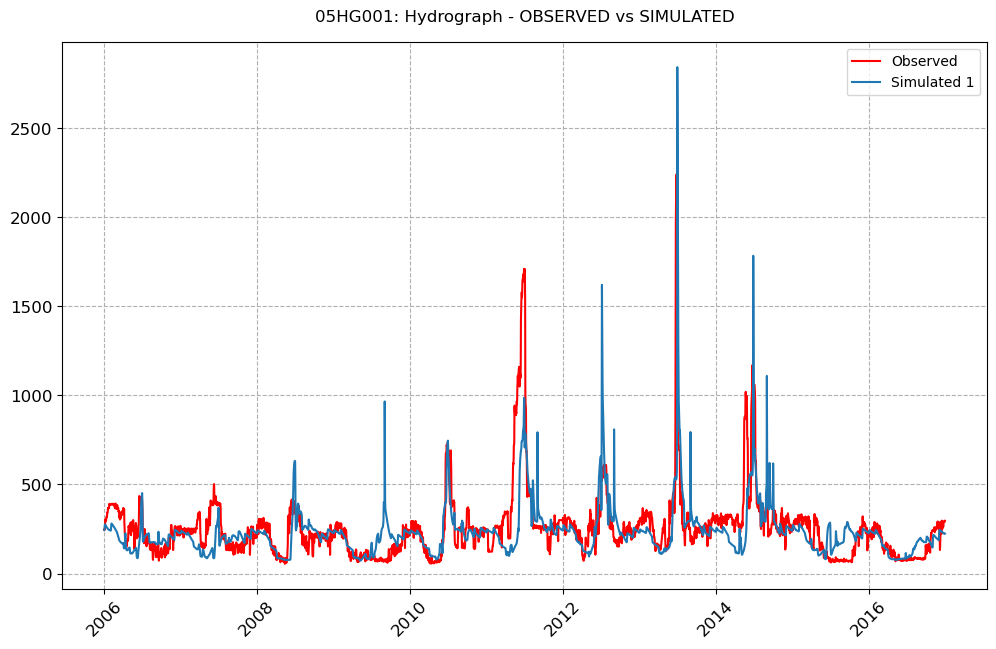
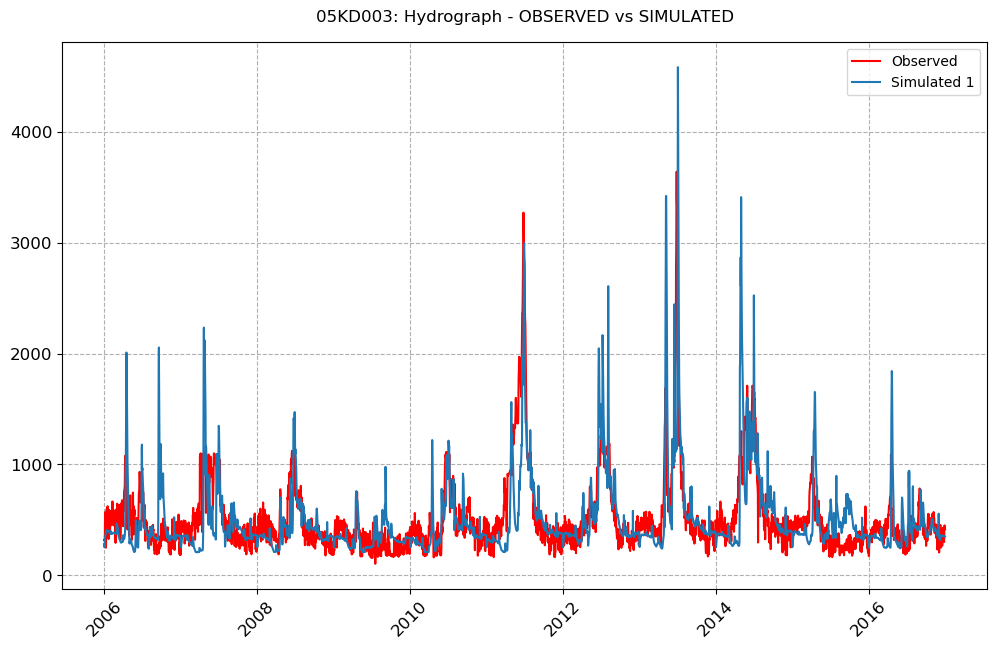
[29]:
# Including the metrics in the plots for the 1st and 4th Stations
visuals.plot(
    merged_df = merged_df.loc[:, [col for col in stations_a if col in merged_df.columns]],
    # including multiple plot titles
    title = [f"{i}: Hydrograph - OBSERVED vs SIMULATED" for i in stations_a],
    fig_size=(10, 6),
    linestyles=('m-', 'c-'),
    labels=['Datetime', 'Streamflow Values'],
    legend=["Measured", "Predicted"],
    linewidth=(2, 1.3),
    # include metrics
    metrices = ['KGE', 'RMSE', 'NSE', 'LOGNSE'],
    grid=True,
    )
Number of simulated data columns: 1
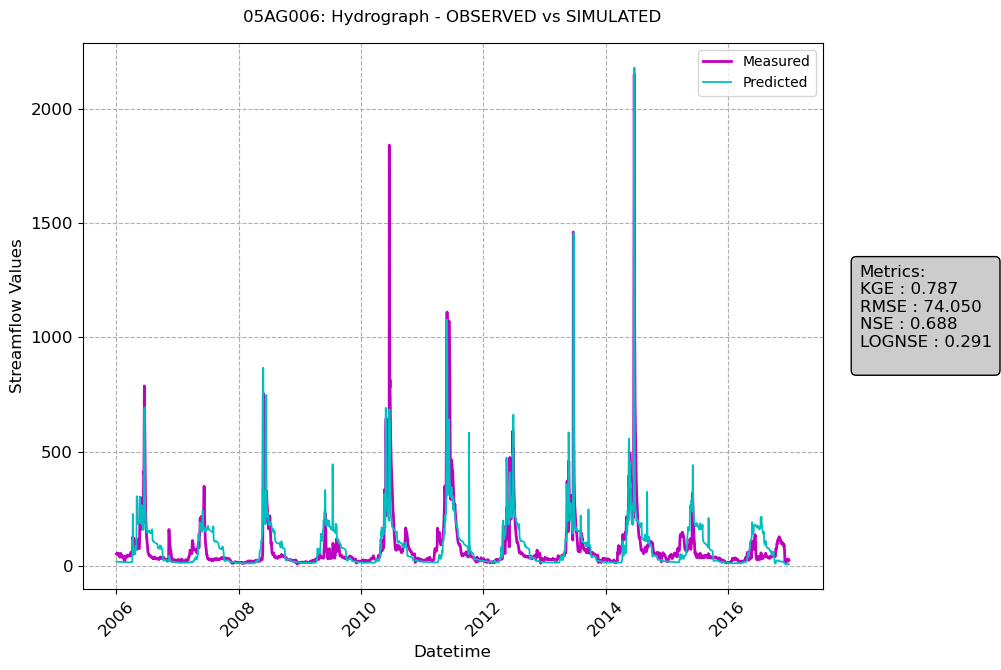
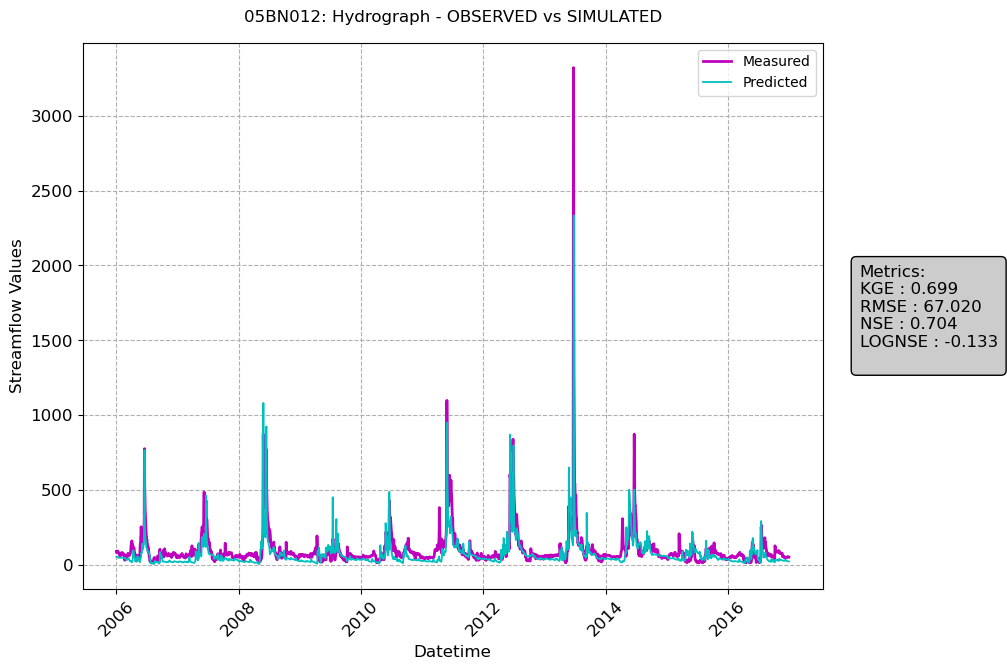
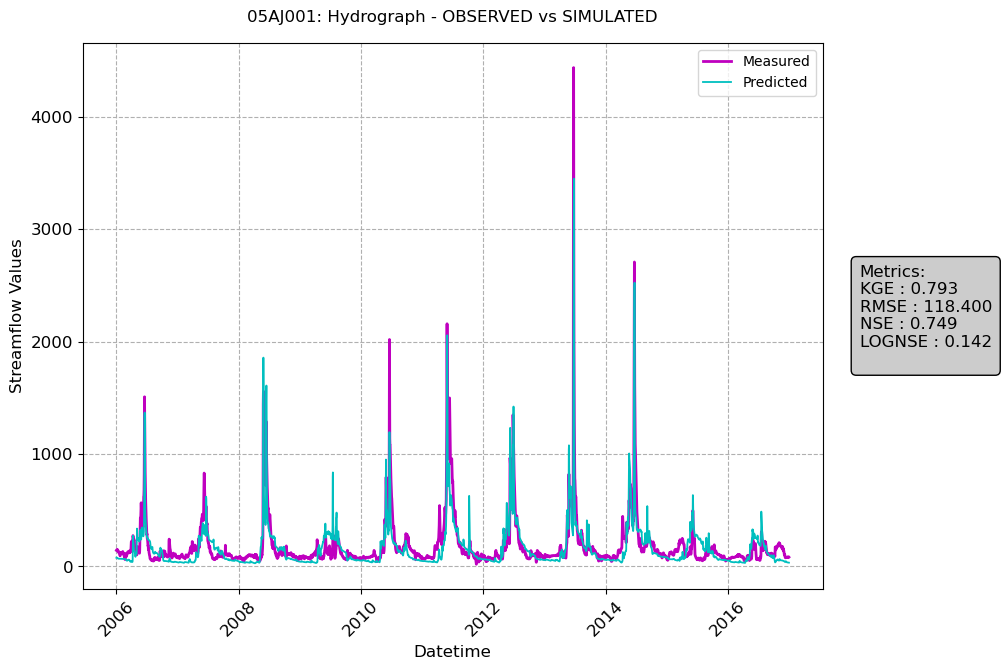
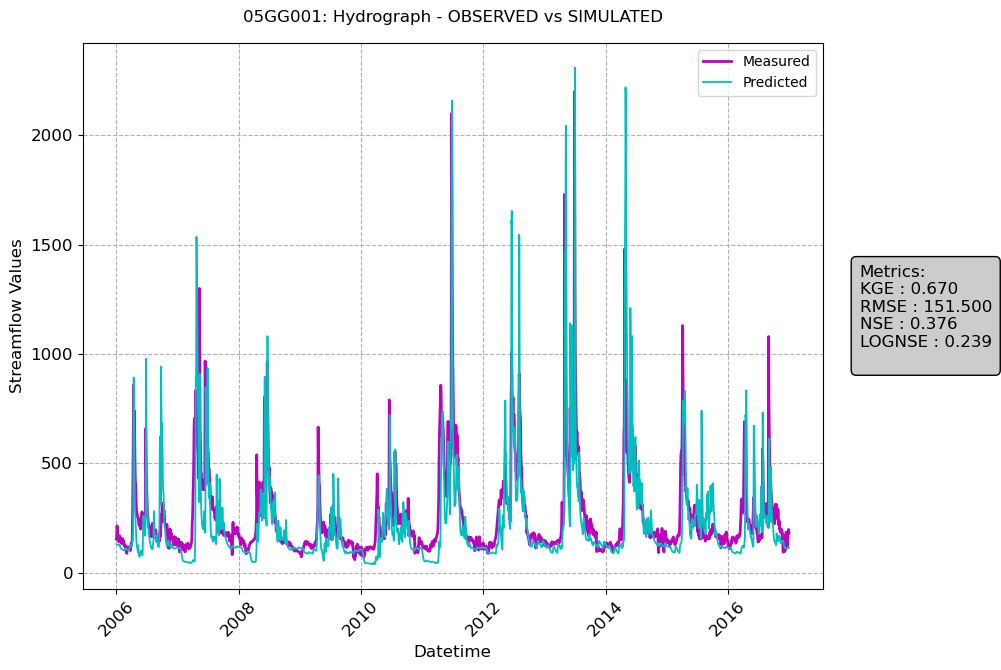
[30]:
median = data.long_term_seasonal(df=merged_df, method = "median")
maxi = data.long_term_seasonal(df=merged_df, method = "max")
mini = data.long_term_seasonal(df=merged_df, method = "min")
[31]:
visuals.bounded_plot(
    lines = median.loc[:, [(col, 'QOMEAS') for col in stations_a if col in median.columns]],
    upper_bounds = [maxi.loc[:, [(col, 'QOMEAS') for col in stations_a if col in maxi.columns]]],
    lower_bounds = [mini.loc[:, [(col, 'QOMEAS') for col in stations_a if col in mini.columns]]],
    linestyles=['b-'],
    labels=['Datetime', 'Streamflow'],
    grid=True,
    transparency = [0.4, 0.3],
    title = [f"{i}: Long Term Plot - OBSERVED" for i in stations_a]
    )
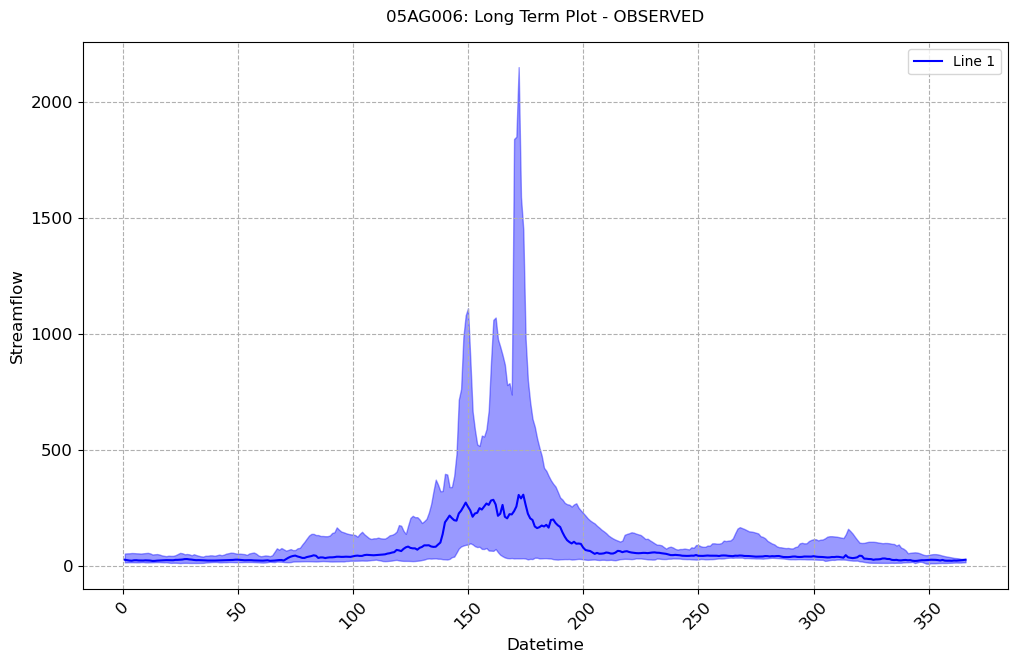
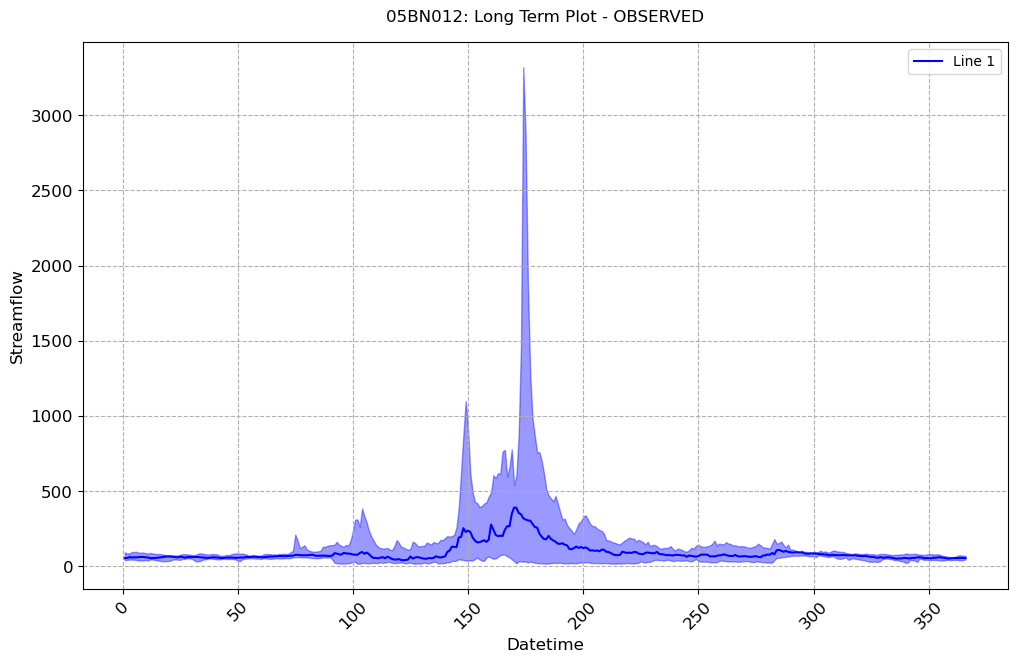
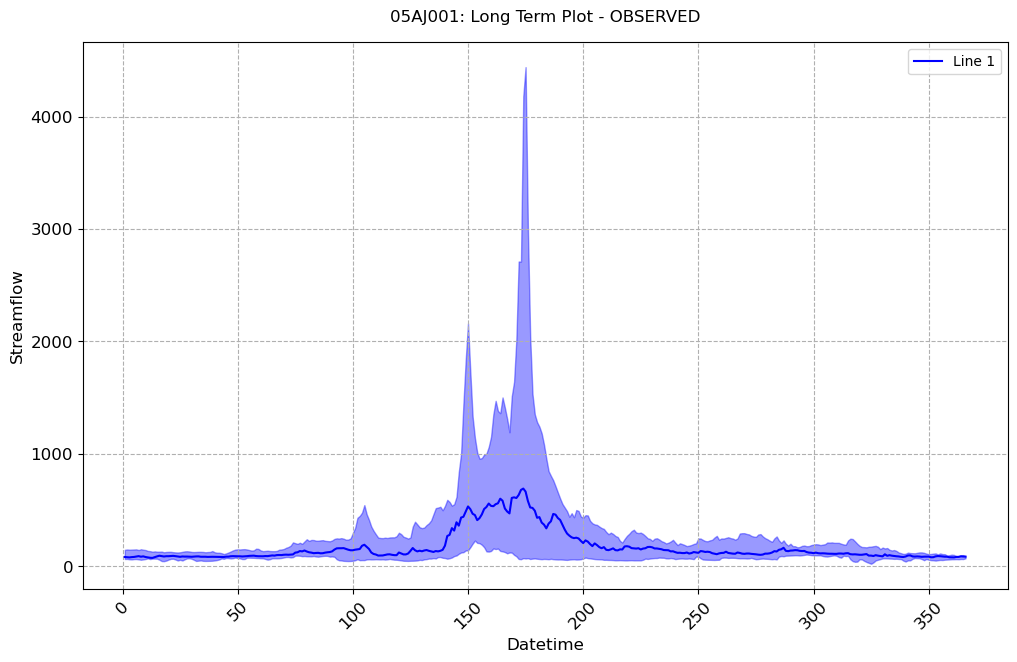
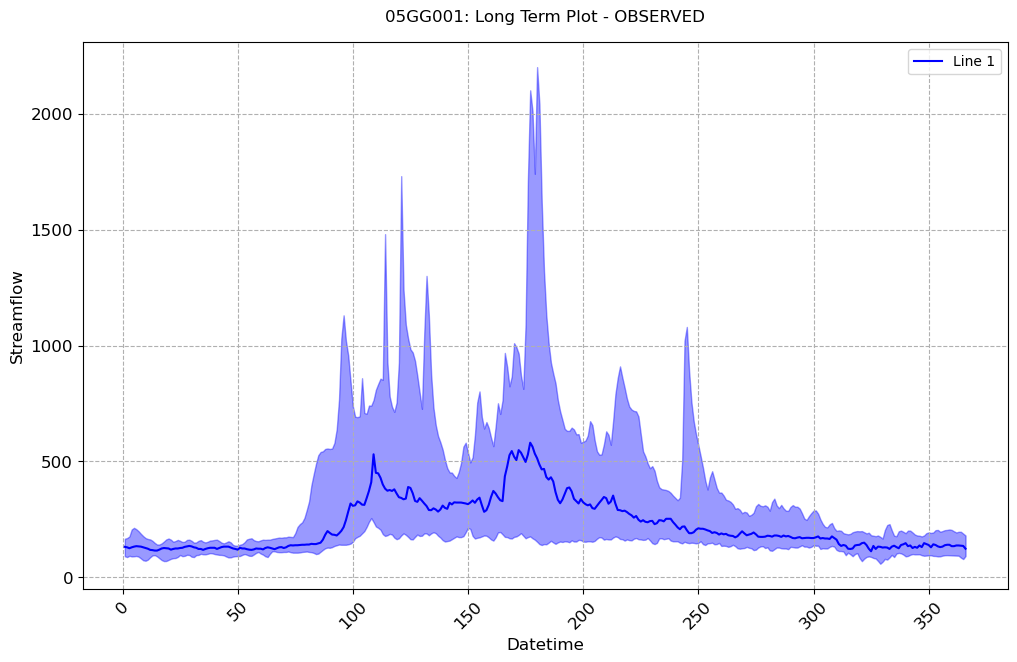
[32]:
visuals.bounded_plot(
    lines = median.loc[:, [(col, 'QOSIM1') for col in stations_b if col in median.columns]],
    upper_bounds = [maxi.loc[:, [(col, 'QOSIM1') for col in stations_b if col in maxi.columns]]],
    lower_bounds = [mini.loc[:, [(col, 'QOSIM1') for col in stations_b if col in mini.columns]]],
    linestyles=['b-'],
    labels=['Datetime', 'Streamflow'],
    grid=True,
    transparency = [0.4, 0.3],
    title = [f"{i}: Long Term Plot - SIMULATED" for i in stations_b]
    )
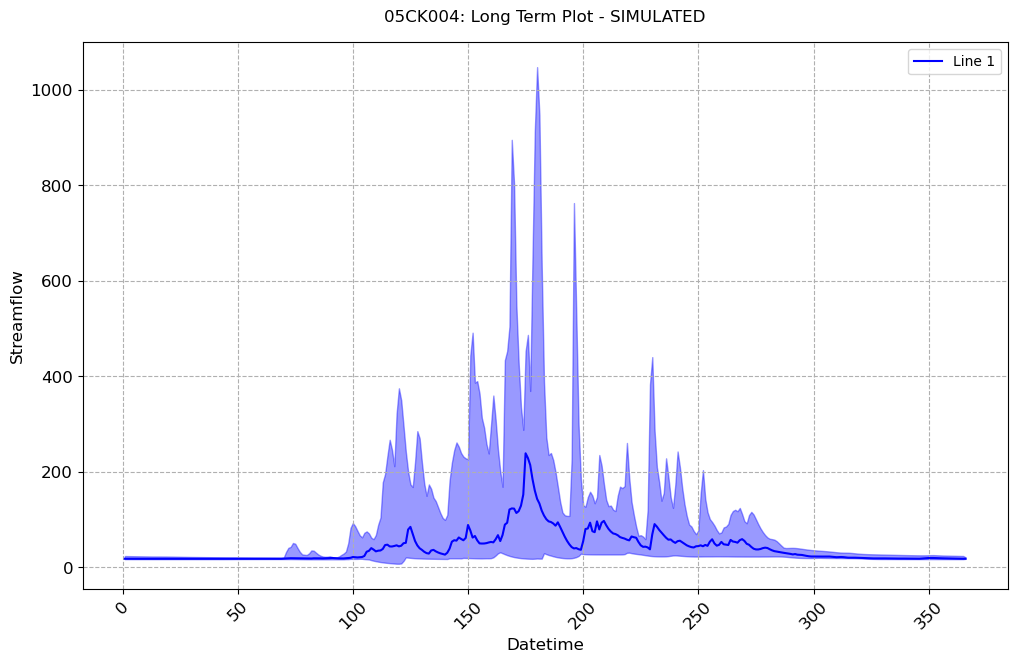
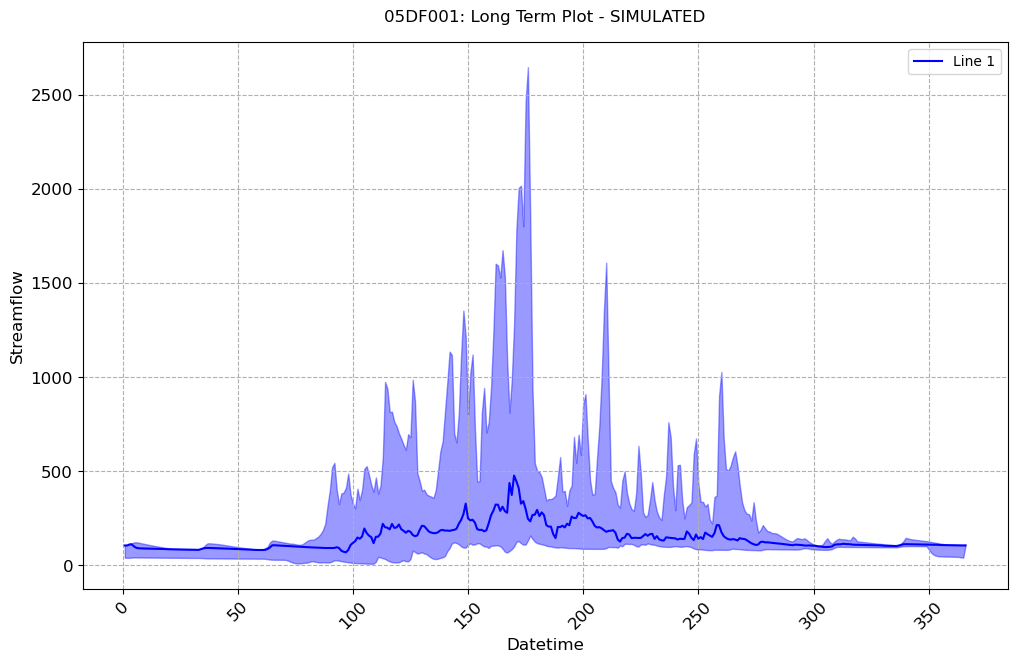
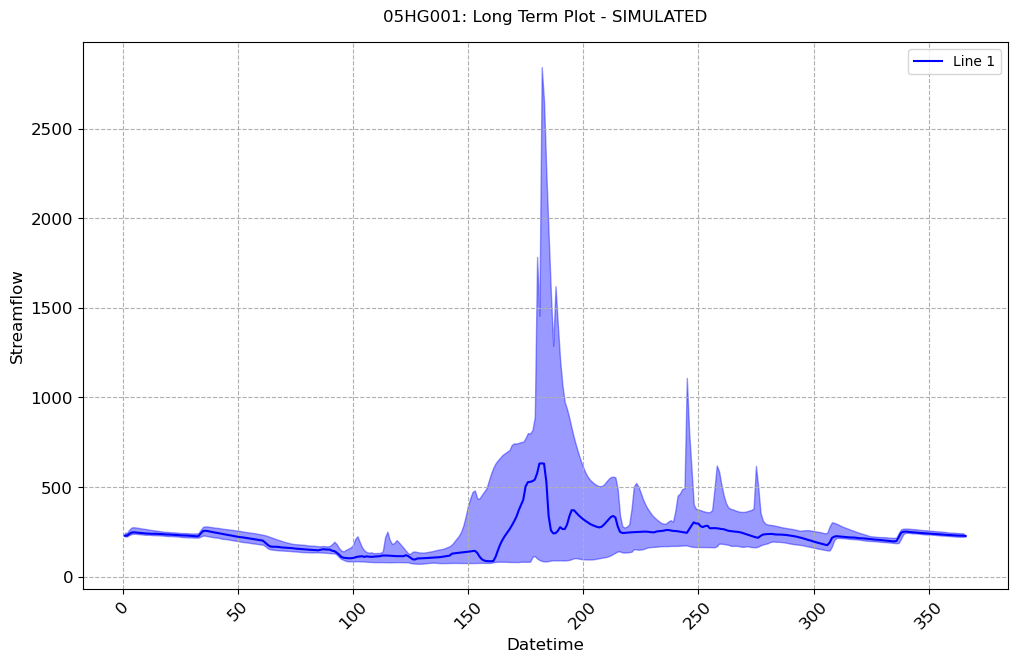
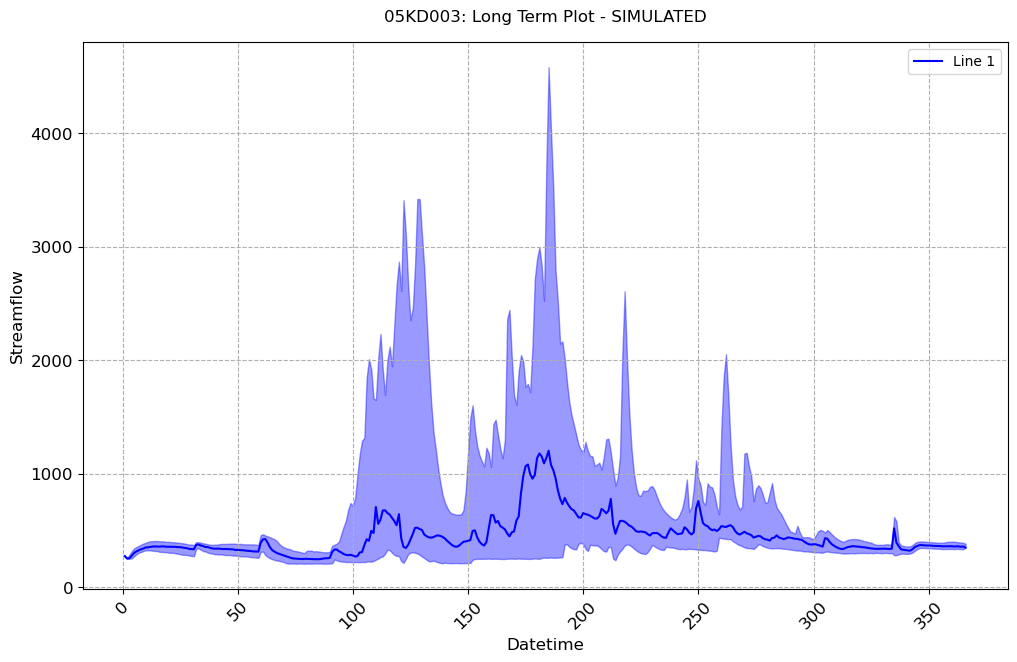
[33]:
visuals.bounded_plot(
    lines = [median.loc[:, [(col, 'QOMEAS') for col in stations_a if col in median.columns]],
             median.loc[:, [(col, 'QOSIM1') for col in stations_a if col in median.columns]]],
    upper_bounds = [maxi.loc[:, [(col, 'QOMEAS') for col in stations_a if col in maxi.columns]],
                    maxi.loc[:, [(col, 'QOSIM1') for col in stations_a if col in maxi.columns]]],
    lower_bounds = [mini.loc[:, [(col, 'QOMEAS') for col in stations_a if col in mini.columns]],
                    mini.loc[:, [(col, 'QOSIM1') for col in stations_a if col in mini.columns]]],
    legend = ['Obs Strflw','Sim Strflw'],
    linestyles=['c-', 'm-',],
    labels=['Days of the year', 'Streamflow Values'],
    transparency = [0.4, 0.25],
    metrices=["TTP", "TTCOM", "SPOD"],
    title = [f"{i}: Long Term Plot - SIMULATED" for i in stations_a],
    grid = True, minor_grid = True, text_size=10
    )
Number of linewidths provided is less than the number of lines to plot. Number of lines : 2. Number of linewidths provided is: 1. Defaulting to 1.5
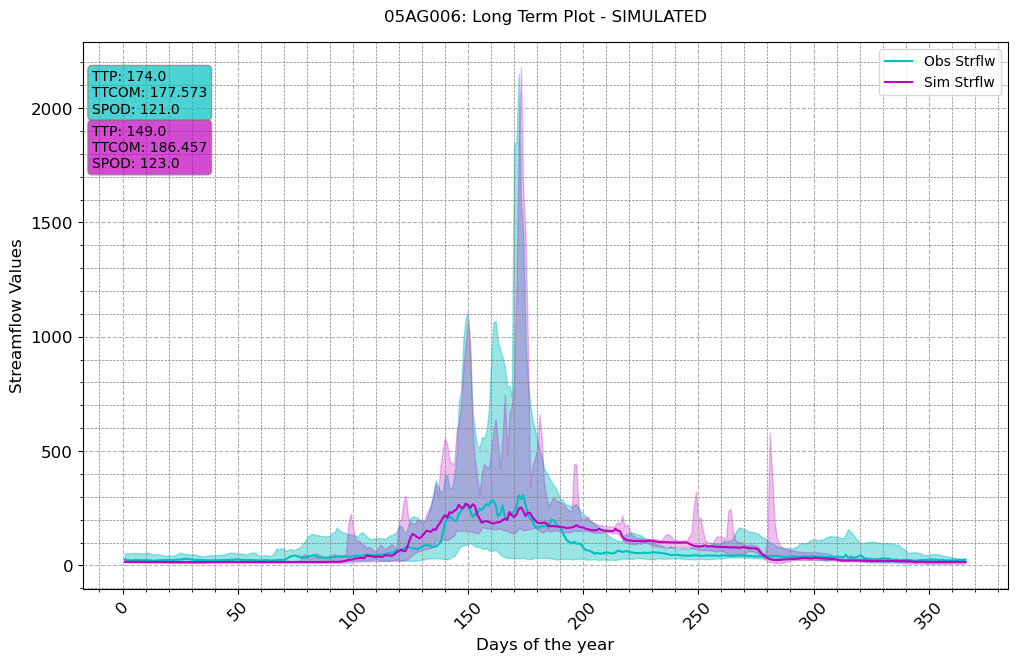
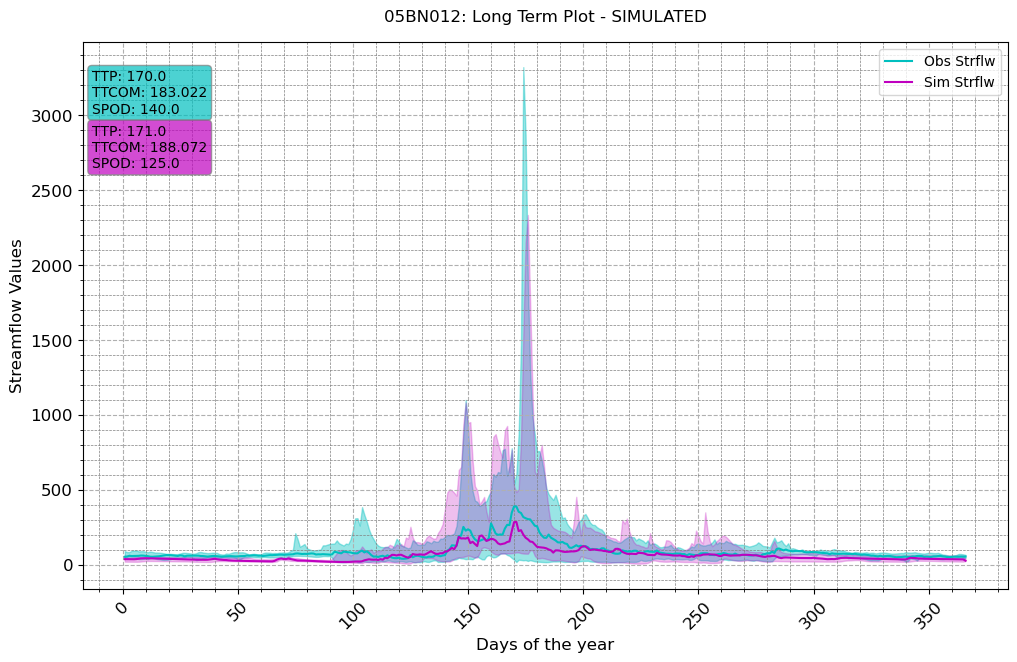
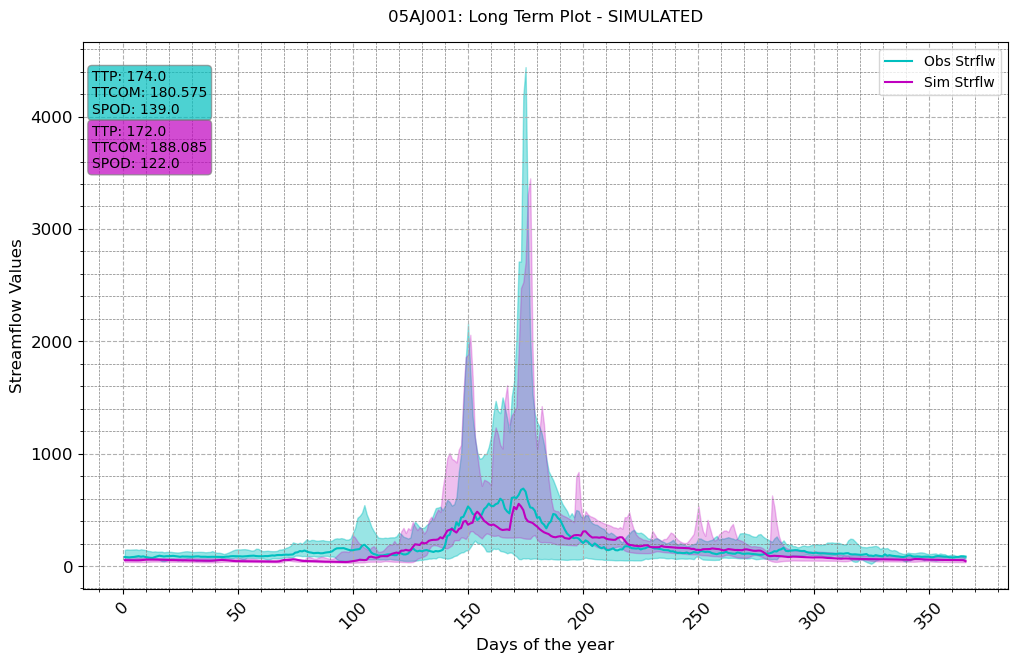
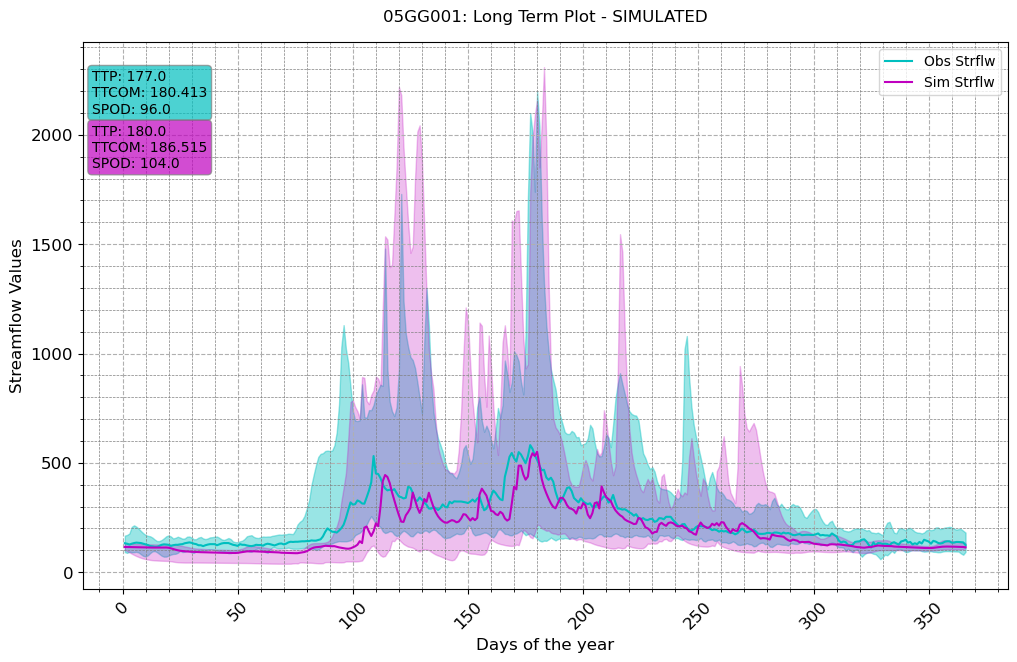
[34]:
visuals.bounded_plot(
    lines = [median.loc[:, [(col, 'QOMEAS') for col in stations_b if col in median.columns]],
             median.loc[:, [(col, 'QOSIM1') for col in stations_b if col in median.columns]]],
    upper_bounds = [maxi.loc[:, [(col, 'QOMEAS') for col in stations_b if col in maxi.columns]],
                    maxi.loc[:, [(col, 'QOSIM1') for col in stations_b if col in maxi.columns]]],
    lower_bounds = [mini.loc[:, [(col, 'QOMEAS') for col in stations_b if col in mini.columns]],
                    mini.loc[:, [(col, 'QOSIM1') for col in stations_b if col in mini.columns]]],
    legend = ['Obs Strflw','Sim Strflw'],
    linestyles=['c-', 'm-',],
    labels=['Days of the year', 'Streamflow Values'],
    transparency = [0.4, 0.25],
    metrices=["TTP", "TTCOM", "SPOD"],
    title = [f"{i}: Long Term Plot - SIMULATED" for i in stations_b],
    grid = True, minor_grid = True, text_size=10
    )
Number of linewidths provided is less than the number of lines to plot. Number of lines : 2. Number of linewidths provided is: 1. Defaulting to 1.5
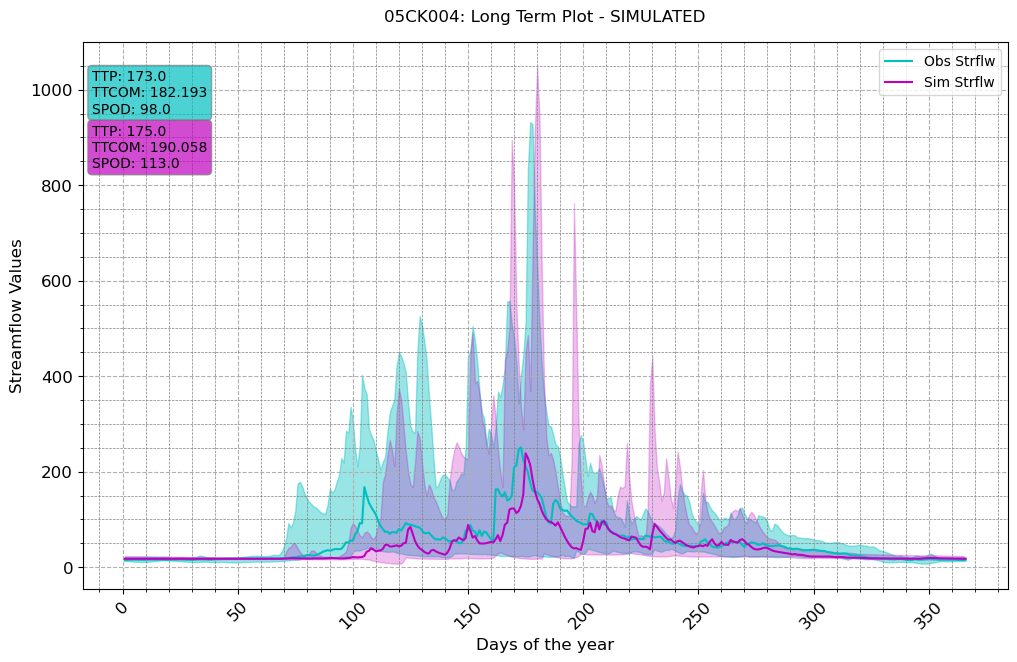
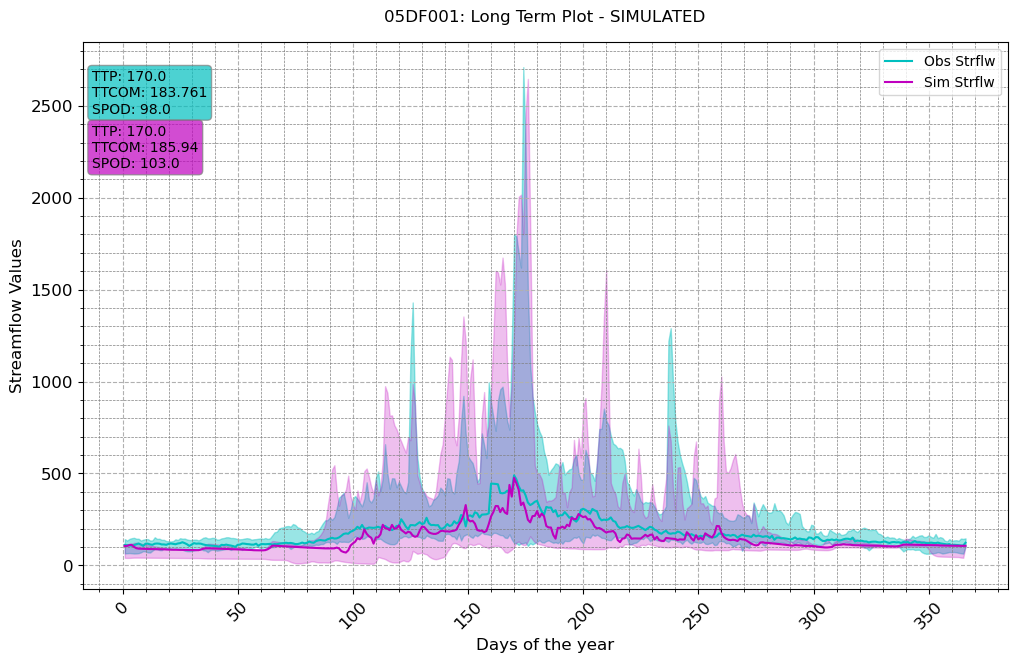
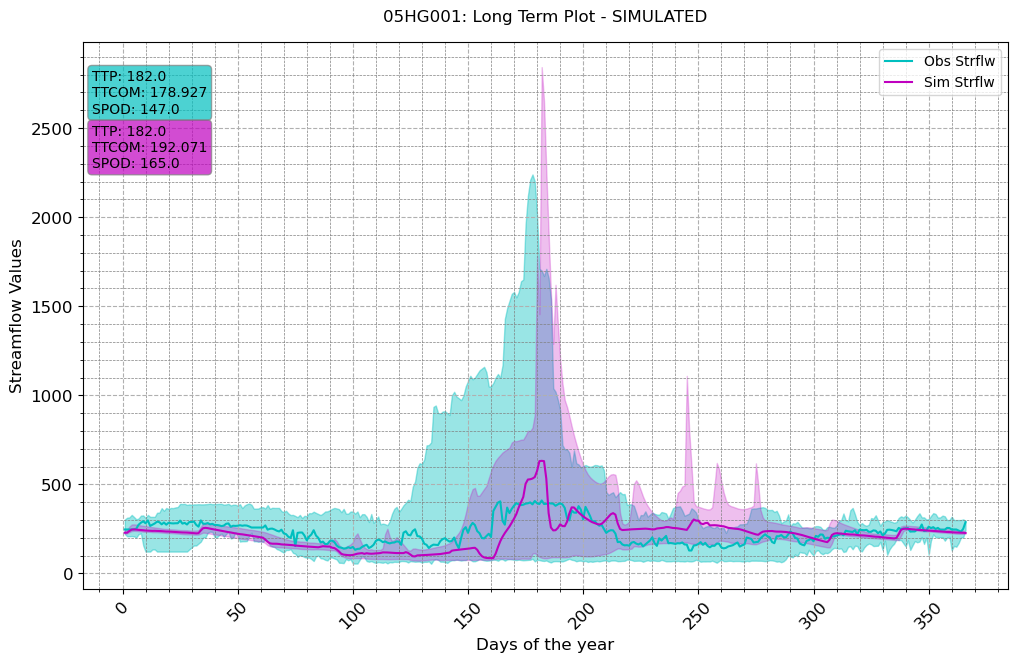
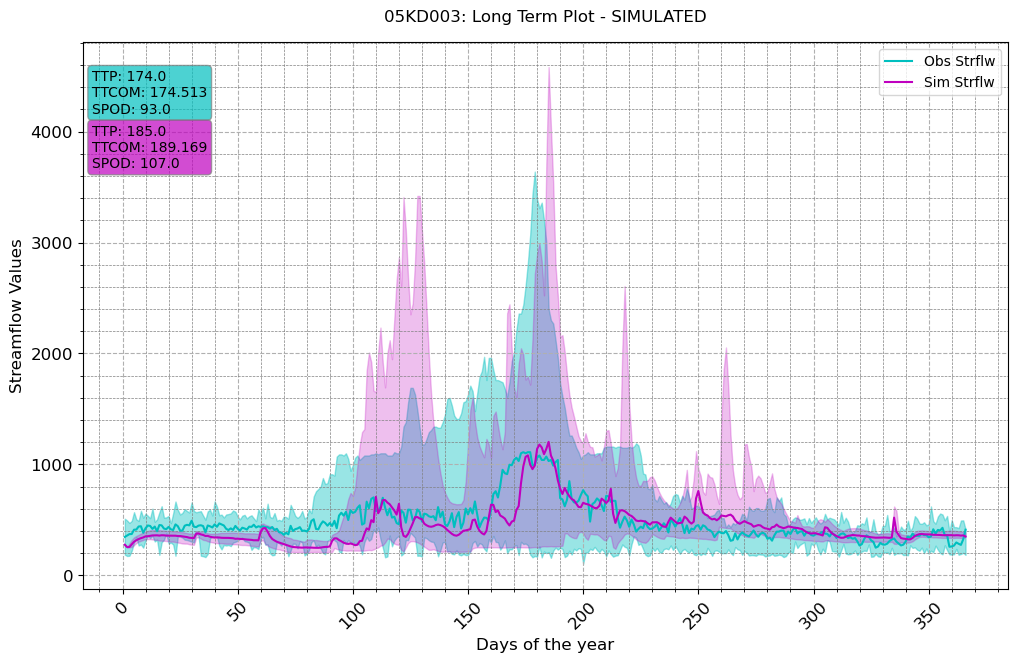
[35]:
visuals.scatter(merged_df = merged_df.loc[:, [col for col in stations_a if col in merged_df.columns]],
               grid = True,
               labels = ("Simulated Data", "Observed Data"),
               markerstyle = ['r.'],
               title = [f"{i}: Scatterplot - 2006 till 2016" for i in stations_a],
               line45 = True,
               metrices = ['KGE', 'RMSE'],
               )
Number of simulated data columns: 1
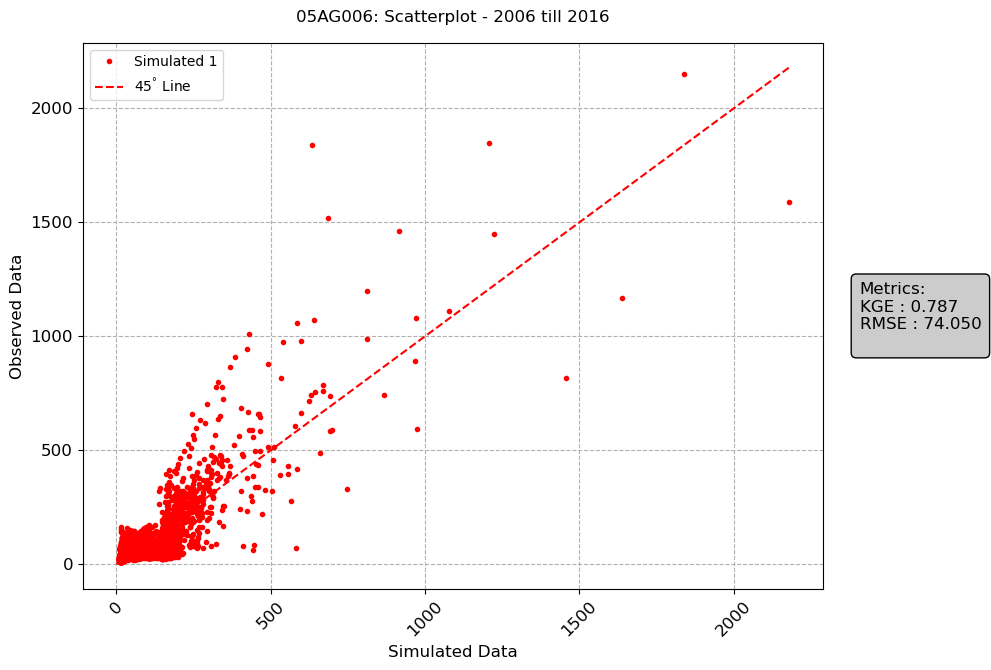
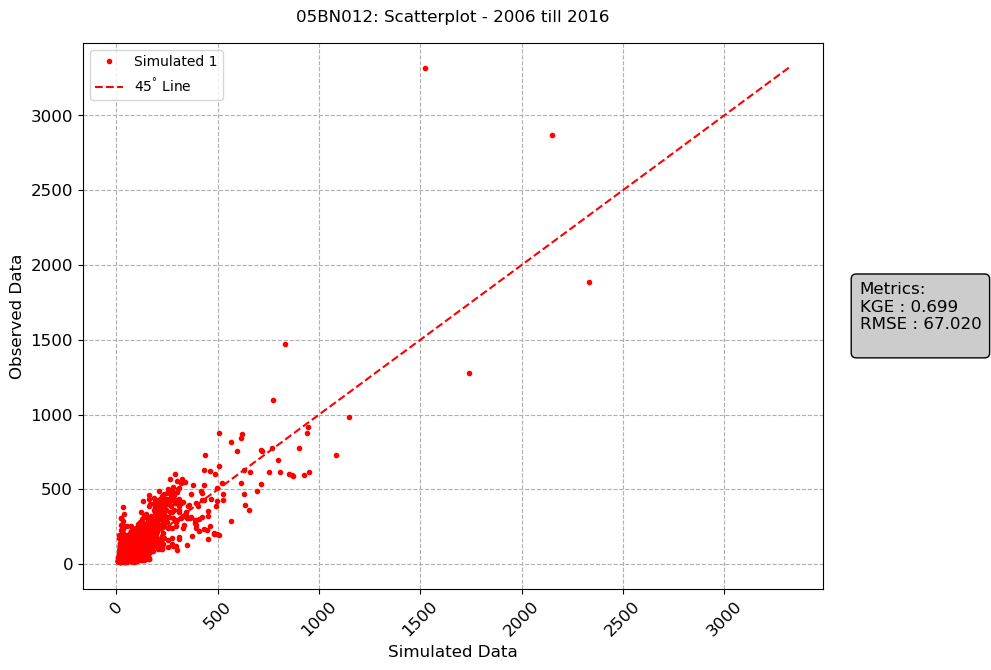
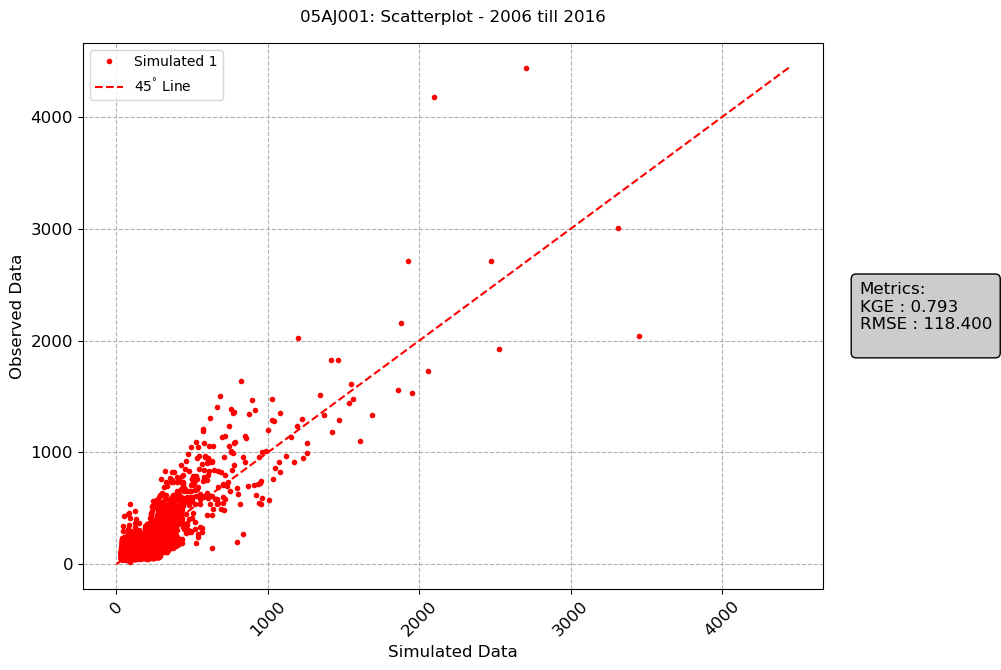
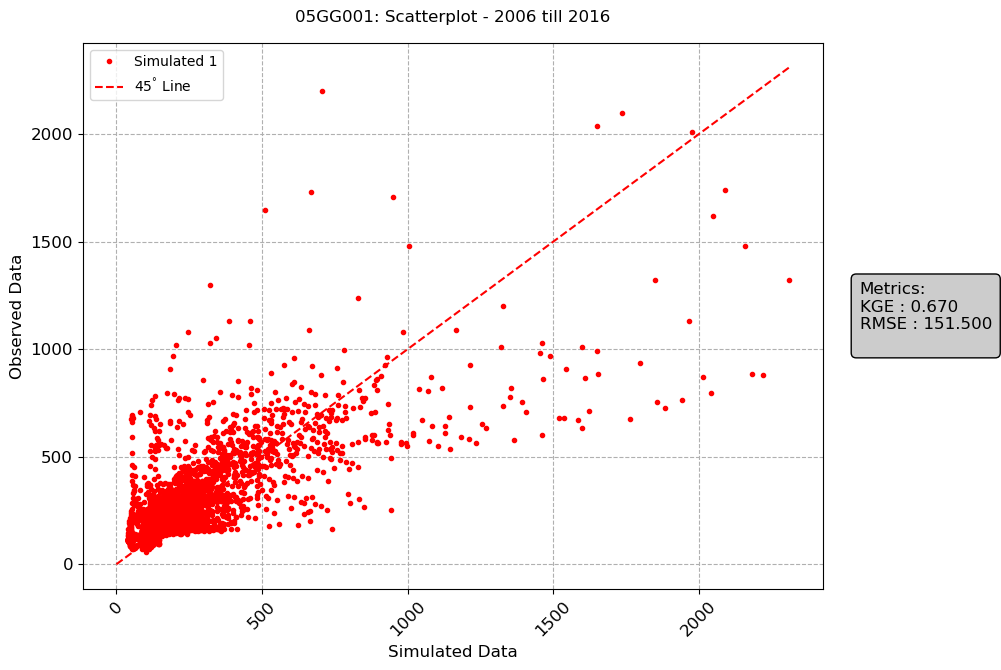
[36]:
shapefile_path = r"SaskRB_SubDrainage2.shp"

visuals.scatter(shapefile_path = shapefile_path,
    title = "KGE distribution",
    x_axis = Stations["Lon"],
    y_axis = Stations["Lat"],
    metric = "KGE",
    fig_size = (10, 10),
    font_size=5,
    markersize=10,
    observed = obs_df,
    simulated = sim_df,
    labels=['Longitude', 'Latitude'],
    vmin = 0,
    vmax=1,
)
C:\Users\udenzeU\Desktop\JUPYTER\postprocessing\docs\source\notebooks\../../..\postprocessinglib\evaluation\visuals.py:242: UserWarning: This figure includes Axes that are not compatible with tight_layout, so results might be incorrect.
  plt.tight_layout()
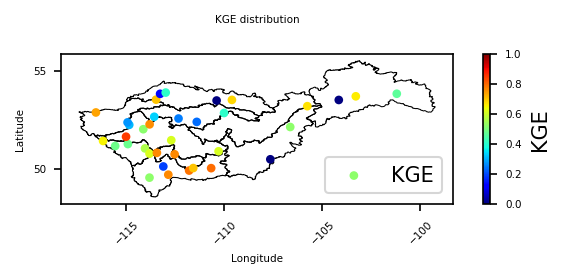
[37]:
shapefile_path = r"SaskRB_SubDrainage2.shp"

visuals.scatter(shapefile_path = shapefile_path,
    title = "SRB SubDrainage showing the NSE distribution",
    x_axis = Stations["Lon"],
    y_axis = Stations["Lat"],
    metric = "NSE",
    fig_size = (10, 10),
    font_size=5,
    markersize=10,
    observed = obs_df,
    simulated = sim_df,
    labels=['Longitude', 'Latitude'],
    vmin = 0,
    vmax=1,
)
C:\Users\udenzeU\Desktop\JUPYTER\postprocessing\docs\source\notebooks\../../..\postprocessinglib\evaluation\visuals.py:242: UserWarning: This figure includes Axes that are not compatible with tight_layout, so results might be incorrect.
  plt.tight_layout()
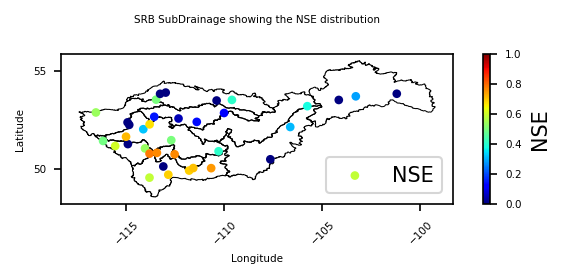
[38]:
visuals.histogram(
    merged_df = merged_df.loc[:, [col for col in stations_a if col in merged_df.columns]],
    grid = True,
    title = [f"{i}: Histogram - 2006 till 2016" for i in stations_a],
)
Number of simulated data columns: 1
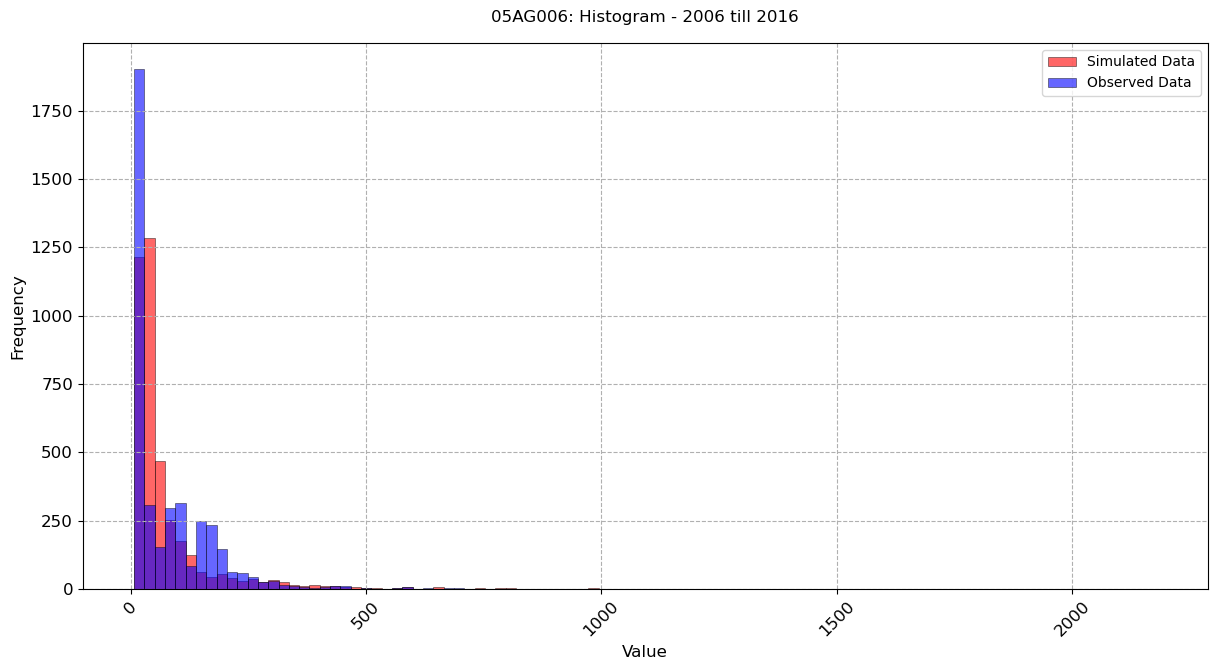
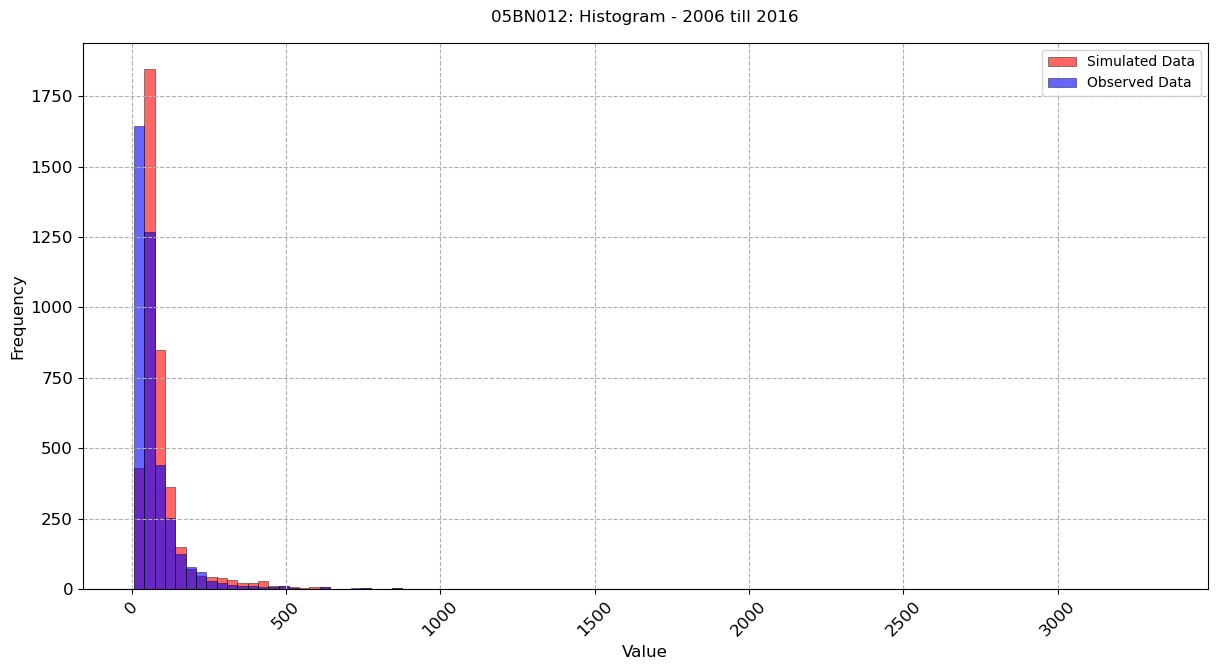
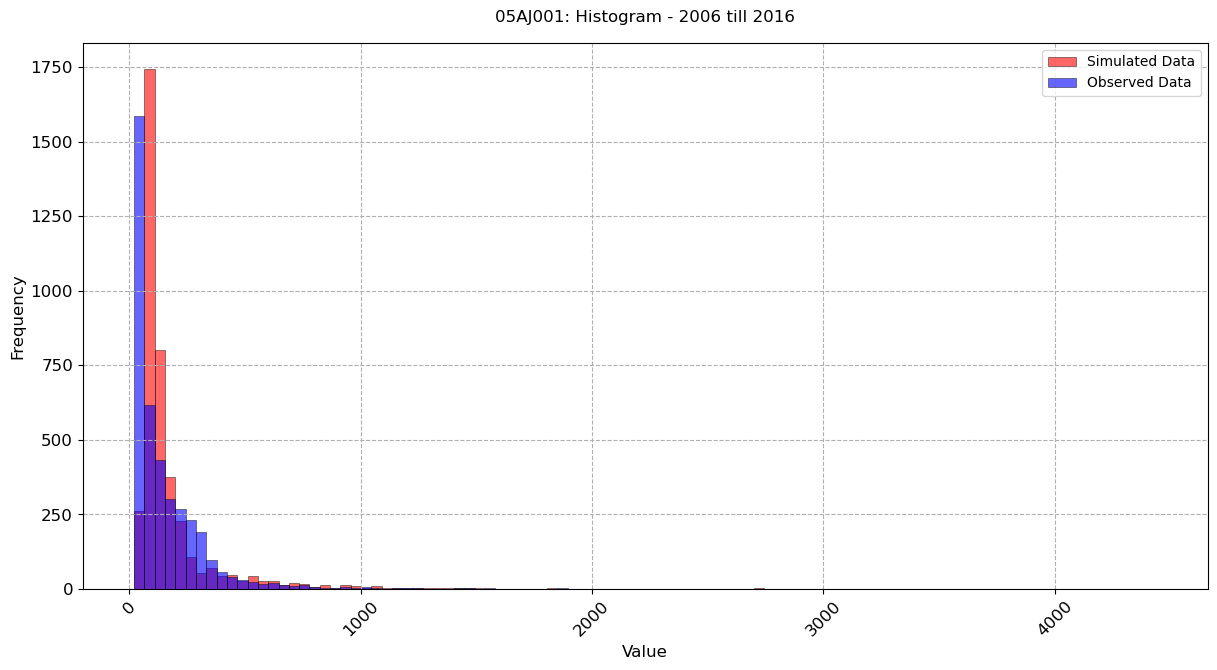
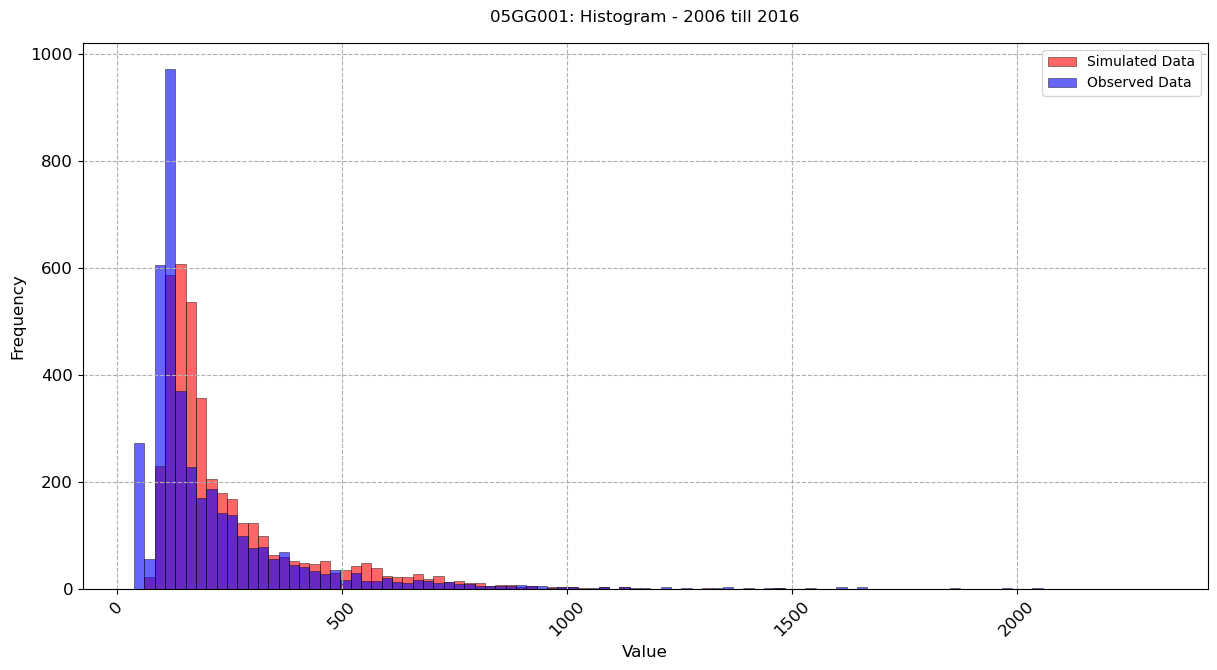
[39]:
visuals.qqplot(
    merged_df =merged_df.loc[:, [col for col in stations_b if col in merged_df.columns]],
    labels=["Quantiles (Simulated)", "Quantiles (Observed)"],
    title=[f"{i}: QQPLOT (OBS vs SIM) - 2006 till 2016" for i in stations_b],
    grid = True
)
Number of simulated data columns: 1
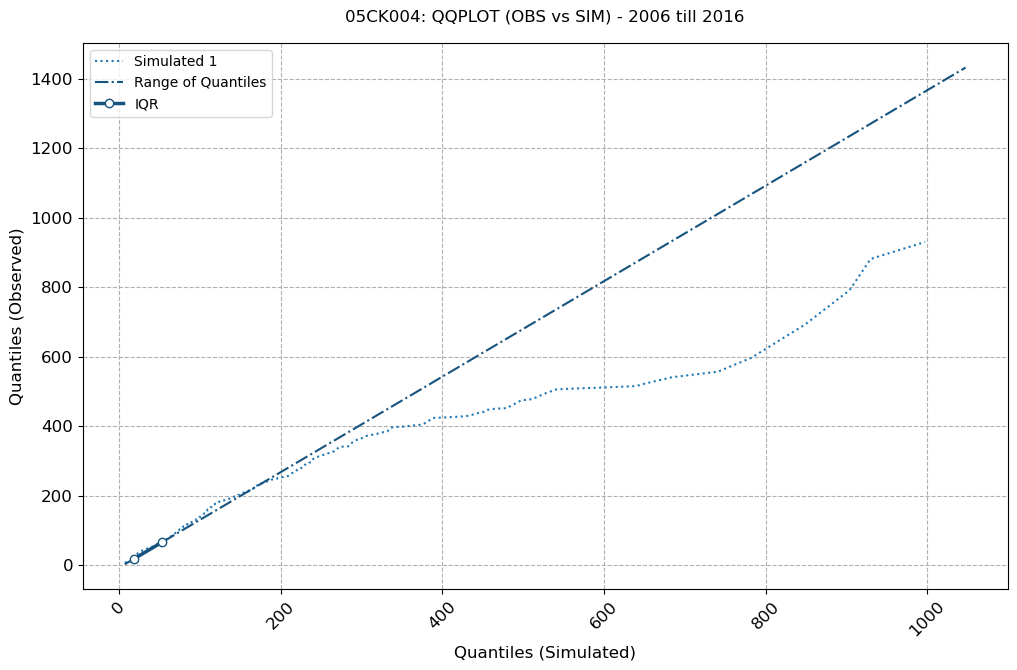
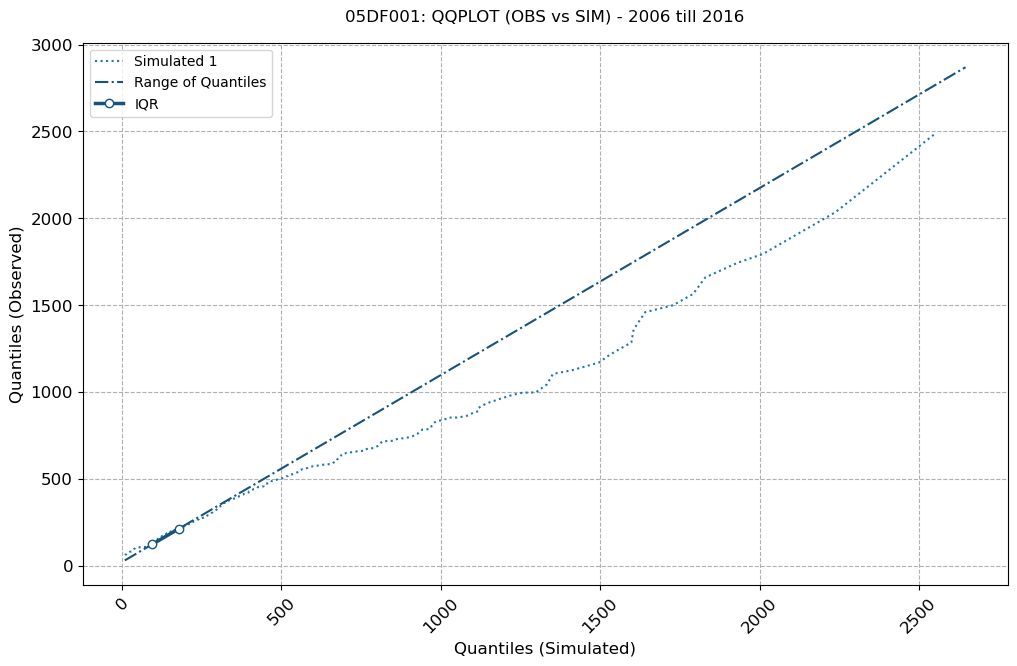
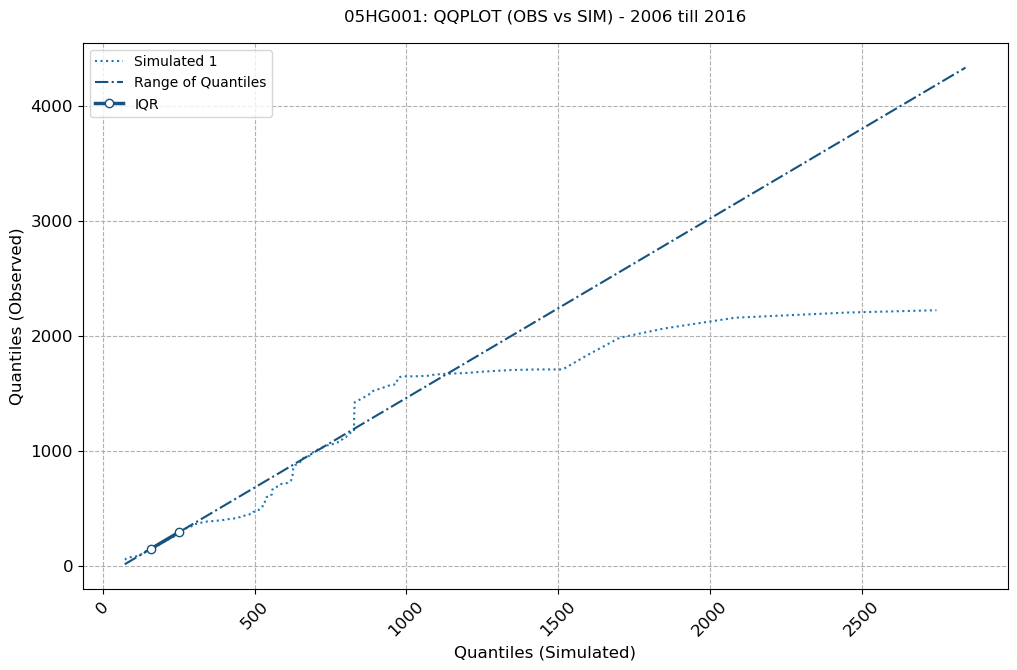
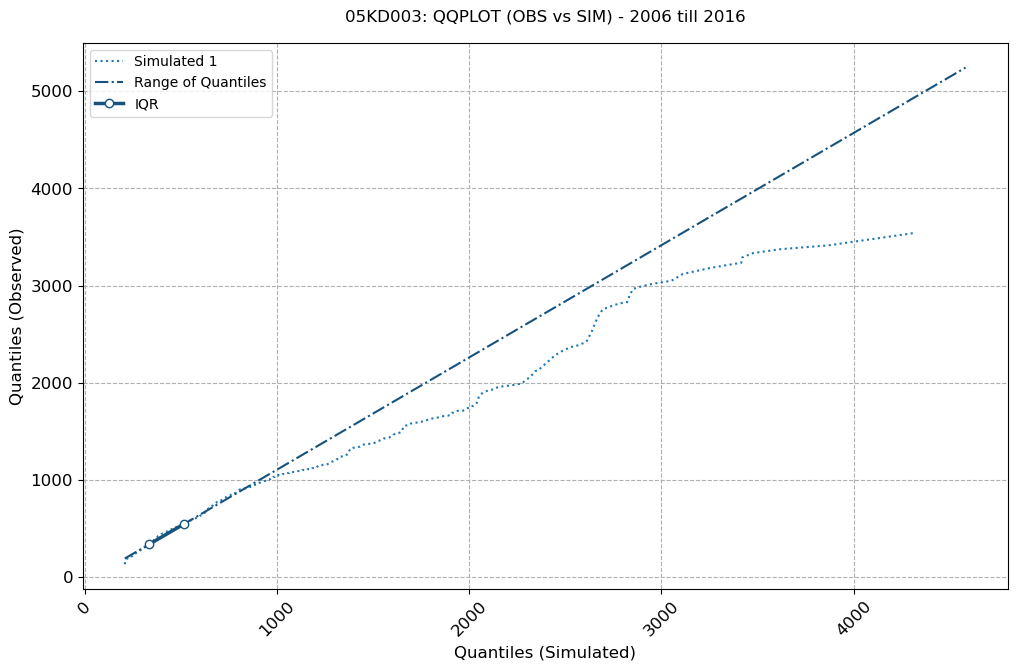
[40]:
visuals.flow_duration_curve(
    merged_df =merged_df.loc[:, [col for col in stations_b if col in merged_df.columns]],
    title=[f"{i}: FDC - 2006 till 2016" for i in stations_b],
    grid = True
)
Number of simulated data columns: 1
Number of linewidths provided is less than the number of columns. Number of columns : 2. Number of linewidths provided is:  1. Defaulting to 1.5
Number of linestyles provided is less than the number of columns. Number of columns : 2. Number of linestyles provided is:  1. Defaulting to solid lines (-)
Number of legends provided is less than the number of columns. Number of columns : 2. Number of legends provided is:  1. Applying Default legend names
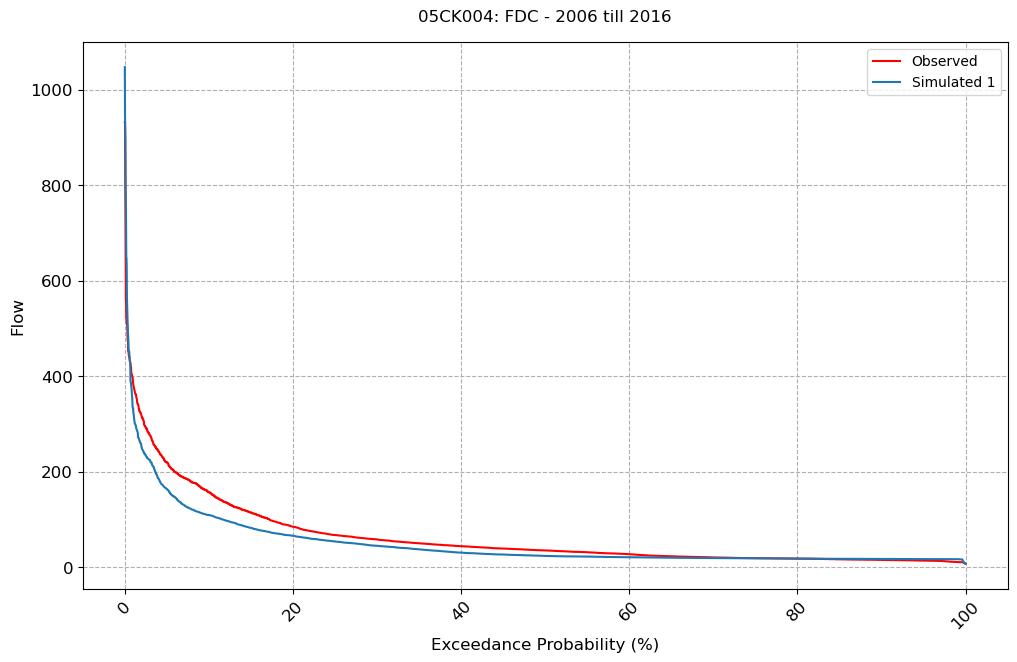
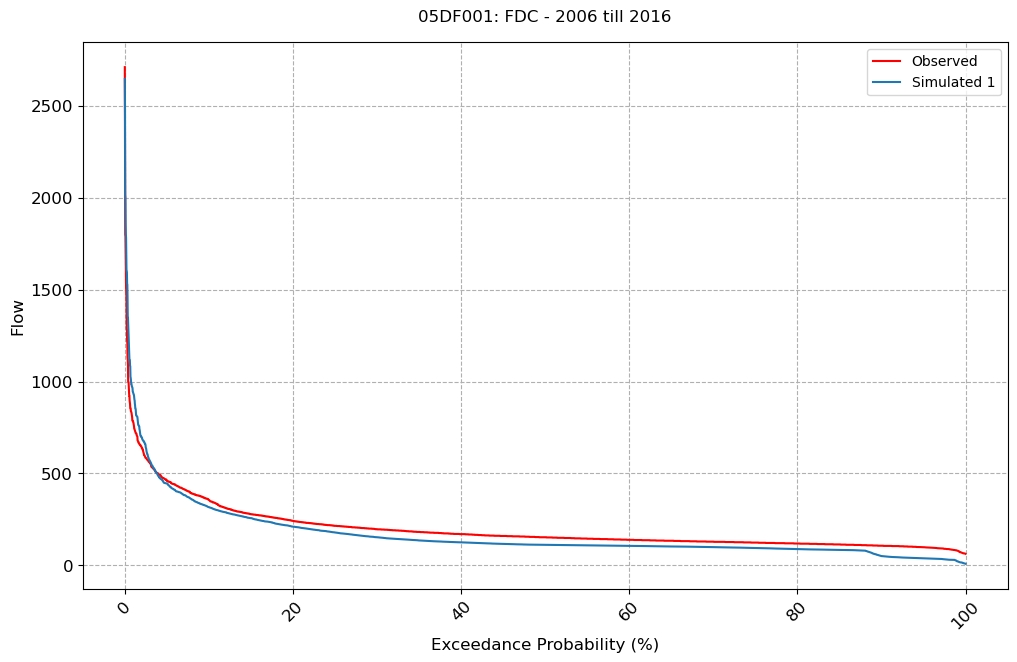
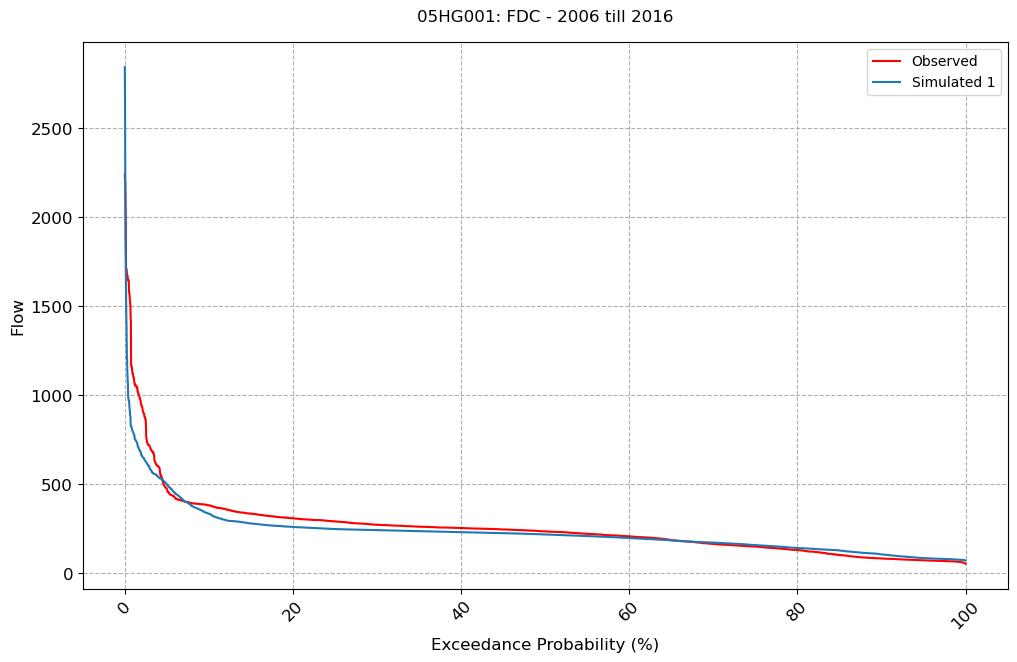
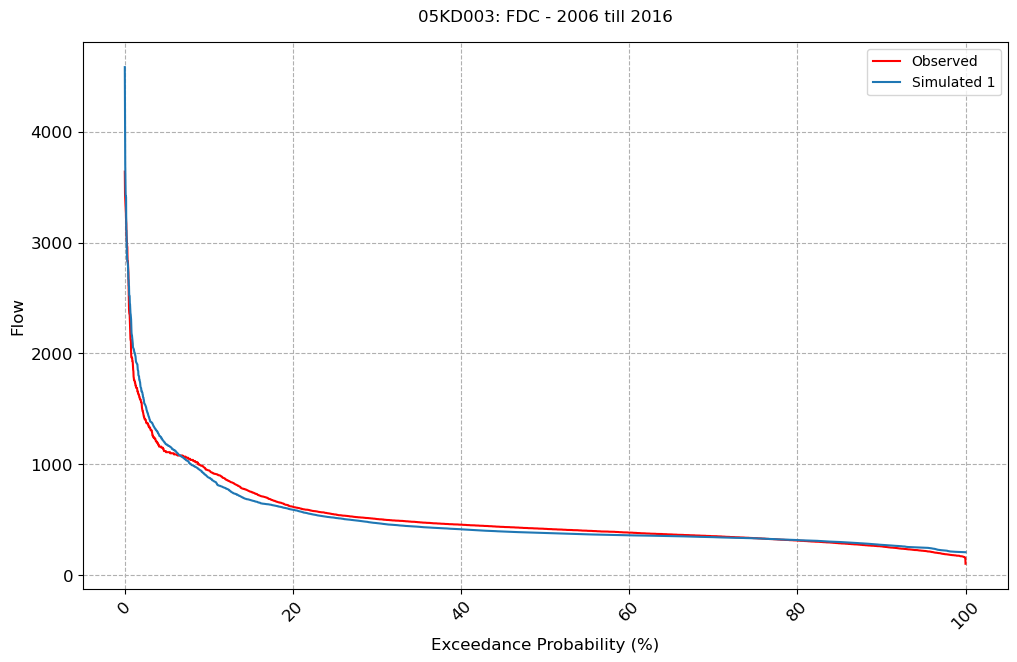
[ ]: