Forecast Analysis Visualization
1. Load the Realtime Data
[1]:
# Import necessary modules and the postprocessing library

import pandas as pd
import glob
import json
from natsort import natsorted


from postprocessinglib.evaluation import data, metrics, visuals
from postprocessinglib.utilities import _helper_functions as hlp
from postprocessinglib.forecast import forecast
The list of stations can be extraxted from the json file that contains the station information, including its latitude, longitude and its identification nummber amongst other things.
[2]:
json_file = '../../../postprocessinglib/forecast/available_stations.json'
# Load the JSON file
with open(json_file, 'r') as f:
    dt = json.load(f)

# Extract station numbers
station_list = [feature['properties']['STATION_NUMBER'] for feature in dt['features']]

# Print or use the list
print(station_list)
['05AA024', '05AC003', '05AD007', '05AG006', '05AJ001', '05BB001', '05BG010', '05BH004', '05BL024', '05BN012', '05CA009', '05CB001', '05CC002', '05CE001', '05CK004', '05DB006', '05DC001', '05DF001', '05EF001', '05FA001', '05FE004', '05GG001', '05HD039', '05HG001', '05KD003', '05KJ001']
Using the MESH-Scripts_pylib LIbrary, we are able to obtain the real-time data from “https://api.weather.gc.ca/”. This Library should already be installed in your conda environment if you followed the steps from the documentation page.
2. Load the Forecast Data
From the forecast library, obtain the predicted data for the next 7 days as available from “https://geo.weather.gc.ca”
[3]:
layer_name = 'DHPS_1km_RiverDischarge'
sim_rt = forecast.generate_nsrps(
    auth_path='../../../postprocessinglib/config.cfg',
    stn_list=station_list,
    layer_name=layer_name,
    stn_locs_file=json_file
)
INFO:postprocessinglib.forecast.forecast:Finished forecast queries for station: 05AA024; iteration: 0
INFO:postprocessinglib.forecast.forecast:Finished forecast queries for station: 05AC003; iteration: 1
INFO:postprocessinglib.forecast.forecast:Finished forecast queries for station: 05AD007; iteration: 2
INFO:postprocessinglib.forecast.forecast:Finished forecast queries for station: 05AG006; iteration: 3
INFO:postprocessinglib.forecast.forecast:Finished forecast queries for station: 05AJ001; iteration: 4
INFO:postprocessinglib.forecast.forecast:Finished forecast queries for station: 05BB001; iteration: 5
INFO:postprocessinglib.forecast.forecast:Finished forecast queries for station: 05BG010; iteration: 6
INFO:postprocessinglib.forecast.forecast:Finished forecast queries for station: 05BH004; iteration: 7
INFO:postprocessinglib.forecast.forecast:Finished forecast queries for station: 05BL024; iteration: 8
INFO:postprocessinglib.forecast.forecast:Finished forecast queries for station: 05BN012; iteration: 9
INFO:postprocessinglib.forecast.forecast:Finished forecast queries for station: 05CA009; iteration: 10
INFO:postprocessinglib.forecast.forecast:Finished forecast queries for station: 05CB001; iteration: 11
INFO:postprocessinglib.forecast.forecast:Finished forecast queries for station: 05CC002; iteration: 12
INFO:postprocessinglib.forecast.forecast:Finished forecast queries for station: 05CE001; iteration: 13
INFO:postprocessinglib.forecast.forecast:Finished forecast queries for station: 05CK004; iteration: 14
INFO:postprocessinglib.forecast.forecast:Finished forecast queries for station: 05DB006; iteration: 15
INFO:postprocessinglib.forecast.forecast:Finished forecast queries for station: 05DC001; iteration: 16
INFO:postprocessinglib.forecast.forecast:Finished forecast queries for station: 05DF001; iteration: 17
INFO:postprocessinglib.forecast.forecast:Finished forecast queries for station: 05EF001; iteration: 18
INFO:postprocessinglib.forecast.forecast:Finished forecast queries for station: 05FA001; iteration: 19
INFO:postprocessinglib.forecast.forecast:Finished forecast queries for station: 05FE004; iteration: 20
INFO:postprocessinglib.forecast.forecast:Finished forecast queries for station: 05GG001; iteration: 21
INFO:postprocessinglib.forecast.forecast:Finished forecast queries for station: 05HD039; iteration: 22
INFO:postprocessinglib.forecast.forecast:Finished forecast queries for station: 05HG001; iteration: 23
INFO:postprocessinglib.forecast.forecast:Finished forecast queries for station: 05KD003; iteration: 24
INFO:postprocessinglib.forecast.forecast:Finished forecast queries for station: 05KJ001; iteration: 25
[4]:
sim_rt
[4]:
| QOSIM_05AA024 | QOSIM_05AC003 | QOSIM_05AD007 | QOSIM_05AG006 | QOSIM_05AJ001 | QOSIM_05BB001 | QOSIM_05BG010 | QOSIM_05BH004 | QOSIM_05BL024 | QOSIM_05BN012 | ... | QOSIM_05DC001 | QOSIM_05DF001 | QOSIM_05EF001 | QOSIM_05FA001 | QOSIM_05FE004 | QOSIM_05GG001 | QOSIM_05HD039 | QOSIM_05HG001 | QOSIM_05KD003 | QOSIM_05KJ001 | |
|---|---|---|---|---|---|---|---|---|---|---|---|---|---|---|---|---|---|---|---|---|---|
| time | |||||||||||||||||||||
| 2025-08-21 01:00:00 | 29.197647 | 2.992298 | 21.514875 | 31.197741 | 154.112488 | 52.039368 | 1.632399 | 102.152969 | 26.462759 | 131.403137 | ... | 148.272736 | 277.365997 | 304.803894 | 0.406227 | 1.310606 | 336.488342 | 1.670751 | 99.070122 | 668.779602 | 476.742004 |
| 2025-08-21 02:00:00 | 29.031300 | 2.980325 | 22.502817 | 31.208633 | 150.454010 | 51.747871 | 1.619201 | 101.089676 | 25.883129 | 133.895432 | ... | 148.943726 | 276.559021 | 303.985382 | 0.412292 | 1.325410 | 335.843048 | 1.692868 | 98.508705 | 636.713013 | 484.087372 |
| 2025-08-21 03:00:00 | 29.314705 | 2.971790 | 22.908522 | 31.232424 | 148.754318 | 51.501019 | 1.606428 | 100.715546 | 25.620071 | 133.966248 | ... | 149.156418 | 276.330933 | 303.256714 | 0.423787 | 1.338618 | 335.572174 | 1.696891 | 98.393562 | 587.616760 | 490.221619 |
| 2025-08-21 04:00:00 | 30.022074 | 2.964017 | 23.307869 | 31.254545 | 147.125793 | 51.258007 | 1.592176 | 100.419998 | 25.364901 | 134.060532 | ... | 149.253281 | 275.992126 | 302.575684 | 0.437036 | 1.348202 | 338.866791 | 1.699967 | 98.396835 | 546.056946 | 496.892212 |
| 2025-08-21 05:00:00 | 30.948421 | 2.956362 | 23.699438 | 31.282217 | 145.554962 | 51.018105 | 1.577966 | 100.197411 | 25.126373 | 134.175690 | ... | 149.315201 | 275.555267 | 301.956116 | 0.451998 | 1.356576 | 347.982758 | 1.702841 | 98.580009 | 517.531616 | 503.556000 |
| ... | ... | ... | ... | ... | ... | ... | ... | ... | ... | ... | ... | ... | ... | ... | ... | ... | ... | ... | ... | ... | ... |
| 2025-08-26 20:00:00 | 31.125116 | 1.444772 | 38.341705 | 47.560795 | 167.437073 | 37.398930 | 1.086554 | 67.402367 | 7.534254 | 135.538864 | ... | 116.041893 | 218.304550 | 306.121918 | 1.162726 | 5.972406 | 421.751526 | 1.431369 | 108.201675 | 712.338379 | 1110.598145 |
| 2025-08-26 21:00:00 | 31.055241 | 1.438629 | 38.273701 | 47.756783 | 167.410233 | 37.341179 | 1.085725 | 67.292953 | 7.502742 | 135.209259 | ... | 115.962578 | 217.571899 | 305.943329 | 1.150025 | 5.904135 | 421.065674 | 1.431818 | 108.159904 | 710.434387 | 1111.714355 |
| 2025-08-26 22:00:00 | 30.978003 | 1.432011 | 38.209480 | 47.928562 | 167.398895 | 37.281357 | 1.084634 | 67.187111 | 7.470065 | 134.841873 | ... | 115.883301 | 216.847229 | 305.773926 | 1.136775 | 5.836592 | 420.443054 | 1.430000 | 108.118843 | 708.841797 | 1112.864258 |
| 2025-08-26 23:00:00 | 30.895966 | 1.424317 | 38.148293 | 48.077663 | 167.402863 | 37.224831 | 1.083908 | 67.084023 | 7.437355 | 134.443069 | ... | 115.808014 | 216.129486 | 305.625336 | 1.123610 | 5.769352 | 419.886353 | 1.427484 | 108.079506 | 707.463074 | 1114.057617 |
| 2025-08-27 00:00:00 | 30.816570 | 1.416683 | 38.094330 | 48.208366 | 167.425125 | 37.167252 | 1.083443 | 66.990730 | 7.406291 | 134.014099 | ... | 115.732552 | 215.421371 | 305.502625 | 1.110218 | 5.703477 | 419.399597 | 1.426561 | 108.041534 | 706.144836 | 1115.297363 |
144 rows × 26 columns
3. Extract the RealTime and Historical Data.
[5]:
MESH_GDPS_file = "C:/Users/udenzeU/OneDrive - EC-EC/Fuad_Mesh_Dataset/srb_prediction_system_multi_run/gem_forecasts/05KJ001/2025072818/GDPS/RESULTS3/MESH_output_streamflow_ts.csv"
MESH_RDPS_file = "C:/Users/udenzeU/OneDrive - EC-EC/Fuad_Mesh_Dataset/srb_prediction_system_multi_run/gem_forecasts/05KJ001/2025072818/RDPS/RESULTS3/MESH_output_streamflow_ts.csv"

merged, lt = forecast.forecast_data_extraction(
    historical=True,
    historical_stat_ubounds=["q95", "q75"],
    historical_stat_lbounds=["q5","q25"],
    stn_list=station_list,
    prediction_files=[sim_rt, MESH_GDPS_file, MESH_RDPS_file],
)
Window 2025-07-21–2025-07-22 in 4.5s
Window 2025-07-22–2025-07-23 in 4.6s
Window 2025-07-23–2025-07-24 in 4.5s
Window 2025-07-24–2025-07-25 in 4.4s
Window 2025-07-25–2025-07-26 in 4.4s
Window 2025-07-26–2025-07-27 in 4.6s
Window 2025-07-27–2025-07-28 in 4.6s
Window 2025-07-28–2025-07-29 in 4.7s
Window 2025-07-29–2025-07-30 in 4.6s
Window 2025-07-30–2025-07-31 in 4.6s
Window 2025-07-31–2025-08-01 in 4.8s
Window 2025-08-01–2025-08-02 in 4.7s
Window 2025-08-02–2025-08-03 in 4.7s
Window 2025-08-03–2025-08-04 in 4.8s
Window 2025-08-04–2025-08-05 in 4.8s
Window 2025-08-05–2025-08-06 in 4.5s
Window 2025-08-06–2025-08-07 in 4.6s
Window 2025-08-07–2025-08-08 in 4.7s
Window 2025-08-08–2025-08-09 in 4.7s
Window 2025-08-09–2025-08-10 in 4.6s
Window 2025-08-10–2025-08-11 in 4.6s
Window 2025-08-11–2025-08-12 in 4.5s
Window 2025-08-12–2025-08-13 in 4.9s
Window 2025-08-13–2025-08-14 in 4.6s
Window 2025-08-14–2025-08-15 in 4.6s
Window 2025-08-15–2025-08-16 in 4.6s
Window 2025-08-16–2025-08-17 in 4.5s
Window 2025-08-17–2025-08-18 in 4.6s
Window 2025-08-18–2025-08-19 in 4.6s
Window 2025-08-19–2025-08-20 in 4.8s
Window 2025-08-20–2025-08-21 in 4.6s
C:\Users\udenzeU\AppData\Local\anaconda3\envs\postprocessing\Lib\site-packages\GeneralProcessing\gen_streamflow_file.py:420: FutureWarning: 'H' is deprecated and will be removed in a future version, please use 'h' instead.
  .resample(f"{freq_hours}H")
C:\Users\udenzeU\AppData\Local\anaconda3\envs\postprocessing\Lib\site-packages\GeneralProcessing\gen_streamflow_file.py:420: FutureWarning: 'H' is deprecated and will be removed in a future version, please use 'h' instead.
  .resample(f"{freq_hours}H")
C:\Users\udenzeU\AppData\Local\anaconda3\envs\postprocessing\Lib\site-packages\GeneralProcessing\gen_streamflow_file.py:420: FutureWarning: 'H' is deprecated and will be removed in a future version, please use 'h' instead.
  .resample(f"{freq_hours}H")
C:\Users\udenzeU\AppData\Local\anaconda3\envs\postprocessing\Lib\site-packages\GeneralProcessing\gen_streamflow_file.py:420: FutureWarning: 'H' is deprecated and will be removed in a future version, please use 'h' instead.
  .resample(f"{freq_hours}H")
C:\Users\udenzeU\AppData\Local\anaconda3\envs\postprocessing\Lib\site-packages\GeneralProcessing\gen_streamflow_file.py:420: FutureWarning: 'H' is deprecated and will be removed in a future version, please use 'h' instead.
  .resample(f"{freq_hours}H")
C:\Users\udenzeU\AppData\Local\anaconda3\envs\postprocessing\Lib\site-packages\GeneralProcessing\gen_streamflow_file.py:420: FutureWarning: 'H' is deprecated and will be removed in a future version, please use 'h' instead.
  .resample(f"{freq_hours}H")
C:\Users\udenzeU\AppData\Local\anaconda3\envs\postprocessing\Lib\site-packages\GeneralProcessing\gen_streamflow_file.py:420: FutureWarning: 'H' is deprecated and will be removed in a future version, please use 'h' instead.
  .resample(f"{freq_hours}H")
C:\Users\udenzeU\AppData\Local\anaconda3\envs\postprocessing\Lib\site-packages\GeneralProcessing\gen_streamflow_file.py:420: FutureWarning: 'H' is deprecated and will be removed in a future version, please use 'h' instead.
  .resample(f"{freq_hours}H")
C:\Users\udenzeU\AppData\Local\anaconda3\envs\postprocessing\Lib\site-packages\GeneralProcessing\gen_streamflow_file.py:420: FutureWarning: 'H' is deprecated and will be removed in a future version, please use 'h' instead.
  .resample(f"{freq_hours}H")
C:\Users\udenzeU\AppData\Local\anaconda3\envs\postprocessing\Lib\site-packages\GeneralProcessing\gen_streamflow_file.py:420: FutureWarning: 'H' is deprecated and will be removed in a future version, please use 'h' instead.
  .resample(f"{freq_hours}H")
C:\Users\udenzeU\AppData\Local\anaconda3\envs\postprocessing\Lib\site-packages\GeneralProcessing\gen_streamflow_file.py:420: FutureWarning: 'H' is deprecated and will be removed in a future version, please use 'h' instead.
  .resample(f"{freq_hours}H")
C:\Users\udenzeU\AppData\Local\anaconda3\envs\postprocessing\Lib\site-packages\GeneralProcessing\gen_streamflow_file.py:420: FutureWarning: 'H' is deprecated and will be removed in a future version, please use 'h' instead.
  .resample(f"{freq_hours}H")
C:\Users\udenzeU\AppData\Local\anaconda3\envs\postprocessing\Lib\site-packages\GeneralProcessing\gen_streamflow_file.py:420: FutureWarning: 'H' is deprecated and will be removed in a future version, please use 'h' instead.
  .resample(f"{freq_hours}H")
C:\Users\udenzeU\AppData\Local\anaconda3\envs\postprocessing\Lib\site-packages\GeneralProcessing\gen_streamflow_file.py:420: FutureWarning: 'H' is deprecated and will be removed in a future version, please use 'h' instead.
  .resample(f"{freq_hours}H")
C:\Users\udenzeU\AppData\Local\anaconda3\envs\postprocessing\Lib\site-packages\GeneralProcessing\gen_streamflow_file.py:420: FutureWarning: 'H' is deprecated and will be removed in a future version, please use 'h' instead.
  .resample(f"{freq_hours}H")
C:\Users\udenzeU\AppData\Local\anaconda3\envs\postprocessing\Lib\site-packages\GeneralProcessing\gen_streamflow_file.py:420: FutureWarning: 'H' is deprecated and will be removed in a future version, please use 'h' instead.
  .resample(f"{freq_hours}H")
C:\Users\udenzeU\AppData\Local\anaconda3\envs\postprocessing\Lib\site-packages\GeneralProcessing\gen_streamflow_file.py:420: FutureWarning: 'H' is deprecated and will be removed in a future version, please use 'h' instead.
  .resample(f"{freq_hours}H")
C:\Users\udenzeU\AppData\Local\anaconda3\envs\postprocessing\Lib\site-packages\GeneralProcessing\gen_streamflow_file.py:420: FutureWarning: 'H' is deprecated and will be removed in a future version, please use 'h' instead.
  .resample(f"{freq_hours}H")
C:\Users\udenzeU\AppData\Local\anaconda3\envs\postprocessing\Lib\site-packages\GeneralProcessing\gen_streamflow_file.py:420: FutureWarning: 'H' is deprecated and will be removed in a future version, please use 'h' instead.
  .resample(f"{freq_hours}H")
C:\Users\udenzeU\AppData\Local\anaconda3\envs\postprocessing\Lib\site-packages\GeneralProcessing\gen_streamflow_file.py:420: FutureWarning: 'H' is deprecated and will be removed in a future version, please use 'h' instead.
  .resample(f"{freq_hours}H")
C:\Users\udenzeU\AppData\Local\anaconda3\envs\postprocessing\Lib\site-packages\GeneralProcessing\gen_streamflow_file.py:420: FutureWarning: 'H' is deprecated and will be removed in a future version, please use 'h' instead.
  .resample(f"{freq_hours}H")
C:\Users\udenzeU\AppData\Local\anaconda3\envs\postprocessing\Lib\site-packages\GeneralProcessing\gen_streamflow_file.py:420: FutureWarning: 'H' is deprecated and will be removed in a future version, please use 'h' instead.
  .resample(f"{freq_hours}H")
C:\Users\udenzeU\AppData\Local\anaconda3\envs\postprocessing\Lib\site-packages\GeneralProcessing\gen_streamflow_file.py:420: FutureWarning: 'H' is deprecated and will be removed in a future version, please use 'h' instead.
  .resample(f"{freq_hours}H")
C:\Users\udenzeU\AppData\Local\anaconda3\envs\postprocessing\Lib\site-packages\GeneralProcessing\gen_streamflow_file.py:420: FutureWarning: 'H' is deprecated and will be removed in a future version, please use 'h' instead.
  .resample(f"{freq_hours}H")
C:\Users\udenzeU\AppData\Local\anaconda3\envs\postprocessing\Lib\site-packages\GeneralProcessing\gen_streamflow_file.py:420: FutureWarning: 'H' is deprecated and will be removed in a future version, please use 'h' instead.
  .resample(f"{freq_hours}H")
C:\Users\udenzeU\AppData\Local\anaconda3\envs\postprocessing\Lib\site-packages\GeneralProcessing\gen_streamflow_file.py:420: FutureWarning: 'H' is deprecated and will be removed in a future version, please use 'h' instead.
  .resample(f"{freq_hours}H")
Fetched daily‐mean for 05AA024 in 8.7s
Fetched daily‐mean for 05AC003 in 10.3s
Fetched daily‐mean for 05AD007 in 10.4s
Fetched daily‐mean for 05AG006 in 9.1s
Fetched daily‐mean for 05AJ001 in 9.8s
Fetched daily‐mean for 05BB001 in 9.7s
Fetched daily‐mean for 05BG010 in 8.2s
Fetched daily‐mean for 05BH004 in 9.8s
Fetched daily‐mean for 05BL024 in 9.9s
Fetched daily‐mean for 05BN012 in 9.4s
Fetched daily‐mean for 05CA009 in 10.1s
Fetched daily‐mean for 05CB001 in 9.7s
Fetched daily‐mean for 05CC002 in 9.7s
Fetched daily‐mean for 05CE001 in 9.9s
Fetched daily‐mean for 05CK004 in 10.3s
Fetched daily‐mean for 05DB006 in 9.4s
Fetched daily‐mean for 05DC001 in 5.0s
Fetched daily‐mean for 05DF001 in 9.0s
Fetched daily‐mean for 05EF001 in 9.8s
Fetched daily‐mean for 05FA001 in 9.4s
Fetched daily‐mean for 05FE004 in 10.2s
Fetched daily‐mean for 05GG001 in 9.4s
Fetched daily‐mean for 05HD039 in 9.0s
Fetched daily‐mean for 05HG001 in 8.7s
Fetched daily‐mean for 05KD003 in 9.8s
Fetched daily‐mean for 05KJ001 in 10.5s
Fetched metadata for 05AA024 in 0.2s
Fetched metadata for 05AC003 in 0.1s
Fetched metadata for 05AD007 in 0.1s
Fetched metadata for 05AG006 in 0.1s
Fetched metadata for 05AJ001 in 0.2s
Fetched metadata for 05BB001 in 0.1s
Fetched metadata for 05BG010 in 0.2s
Fetched metadata for 05BH004 in 0.1s
Fetched metadata for 05BL024 in 0.2s
Fetched metadata for 05BN012 in 0.2s
Fetched metadata for 05CA009 in 0.2s
Fetched metadata for 05CB001 in 0.2s
Fetched metadata for 05CC002 in 0.2s
Fetched metadata for 05CE001 in 0.2s
Fetched metadata for 05CK004 in 0.2s
Fetched metadata for 05DB006 in 0.1s
Fetched metadata for 05DC001 in 0.1s
Fetched metadata for 05DF001 in 0.2s
Fetched metadata for 05EF001 in 0.1s
Fetched metadata for 05FA001 in 0.2s
Fetched metadata for 05FE004 in 0.2s
Fetched metadata for 05GG001 in 0.2s
Fetched metadata for 05HD039 in 0.2s
Fetched metadata for 05HG001 in 0.1s
Fetched metadata for 05KD003 in 0.1s
Fetched metadata for 05KJ001 in 0.1s
Skipping correction for ('05AD007', 'QOSIM2') due to negative values.
Skipping correction for ('05AG006', 'QOSIM2') due to negative values.
Skipping correction for ('05BG010', 'QOSIM2') due to negative values.
Skipping correction for ('05CB001', 'QOSIM2') due to negative values.
Skipping correction for ('05BG010', 'QOSIM3') due to negative values.
Skipping correction for ('05CB001', 'QOSIM3') due to negative values.
4. Visualize the Data
[6]:
# Now we plot.
# Specify the Stations of importance.
stations_a = ["05AG006", "05BN012", "05AJ001", "05GG001"]
stations_b = ["05CK004", "05DF001", '05HG001', '05KD003']
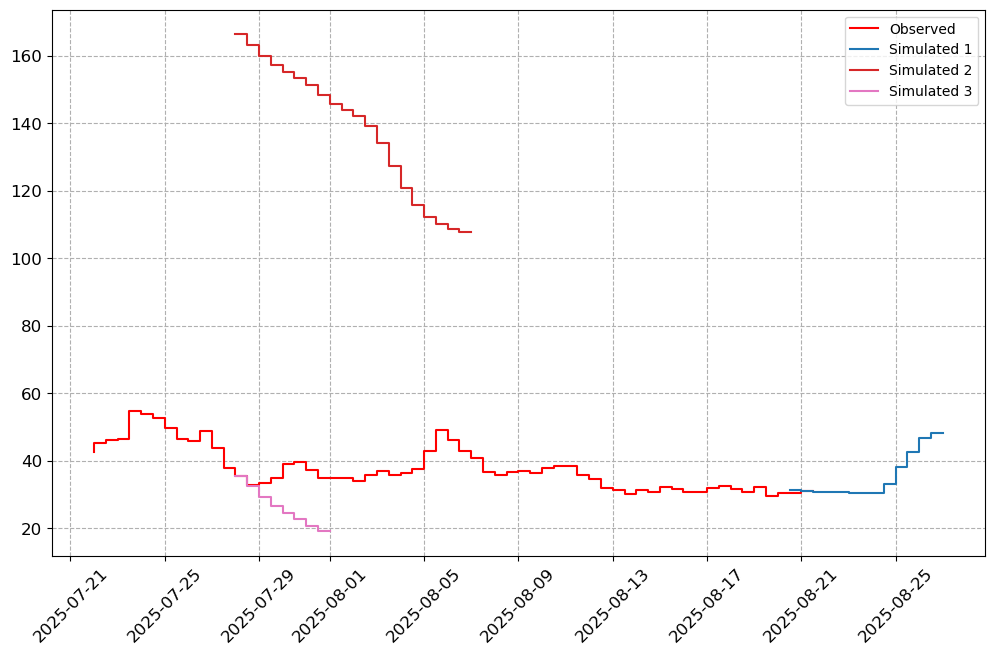
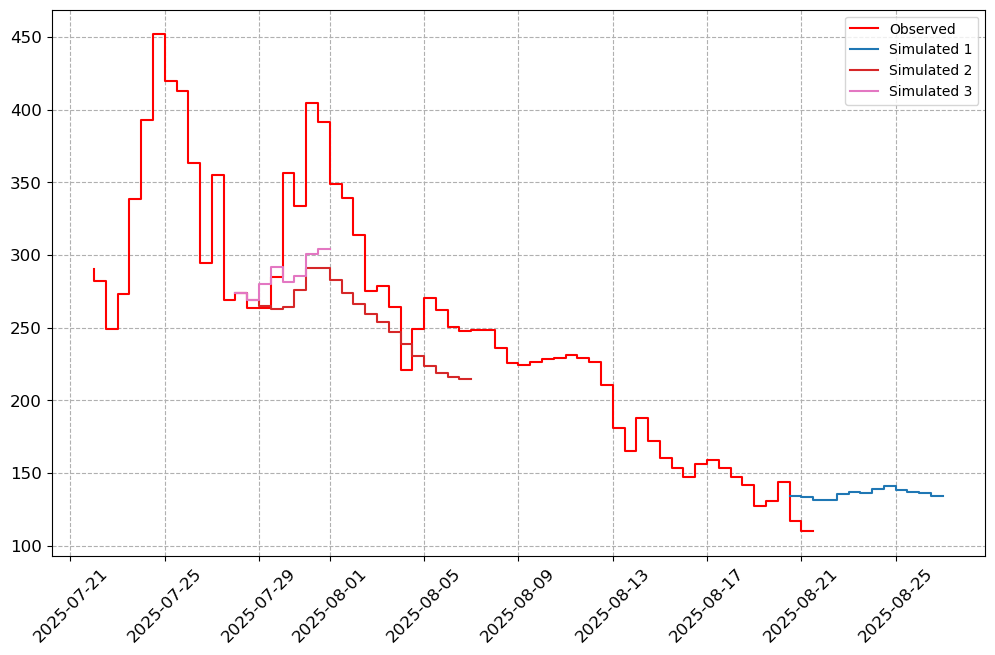
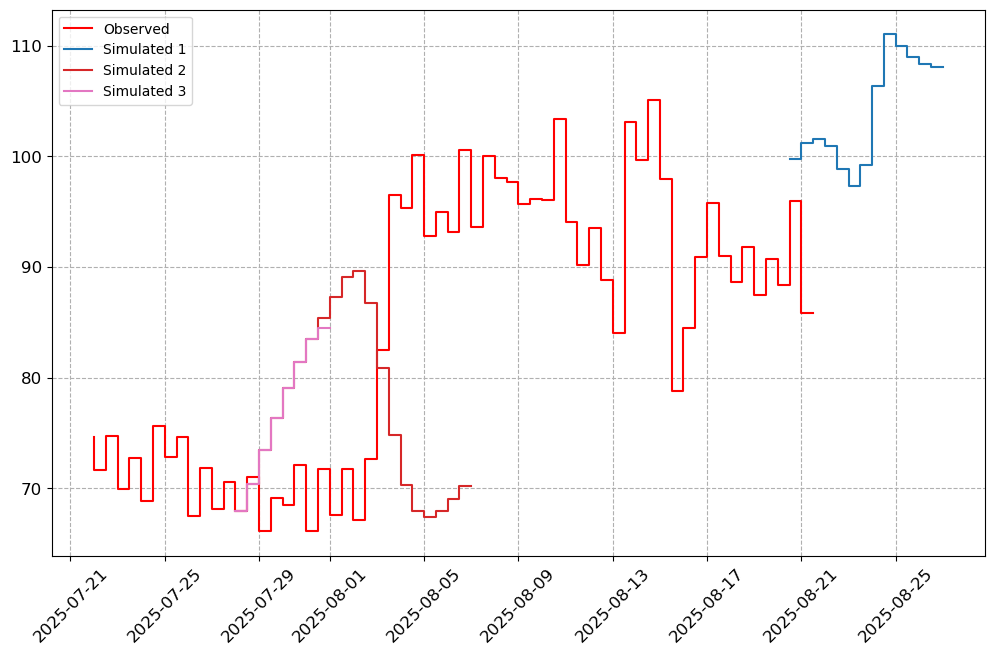
visuals.plot(merged_df = merged.loc[:, [col for col in stations_a if col in merged.columns]],
step = True, grid = True)
Number of simulated data columns: 3
Number of linewidths provided is less than the number of columns. Number of columns : 4. Number of linewidths provided is:  1. Defaulting to 1.5
Number of linestyles provided is less than the number of columns. Number of columns : 4. Number of linestyles provided is:  1. Defaulting to solid lines (-)
Number of legends provided is less than the number of columns. Number of columns : 4. Number of legends provided is:  1. Applying Default legend names
[7]:
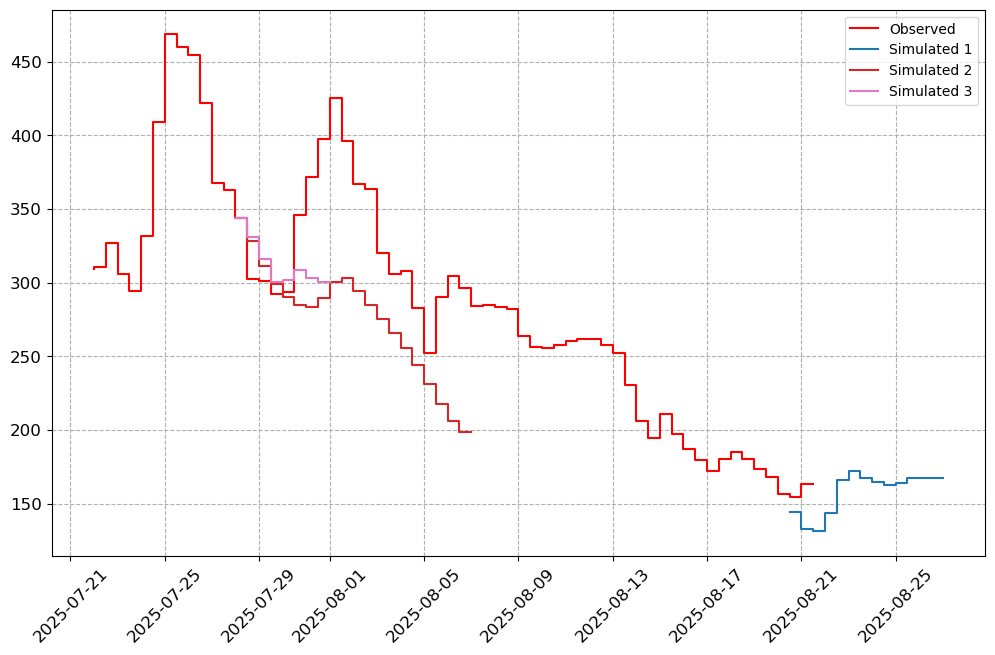
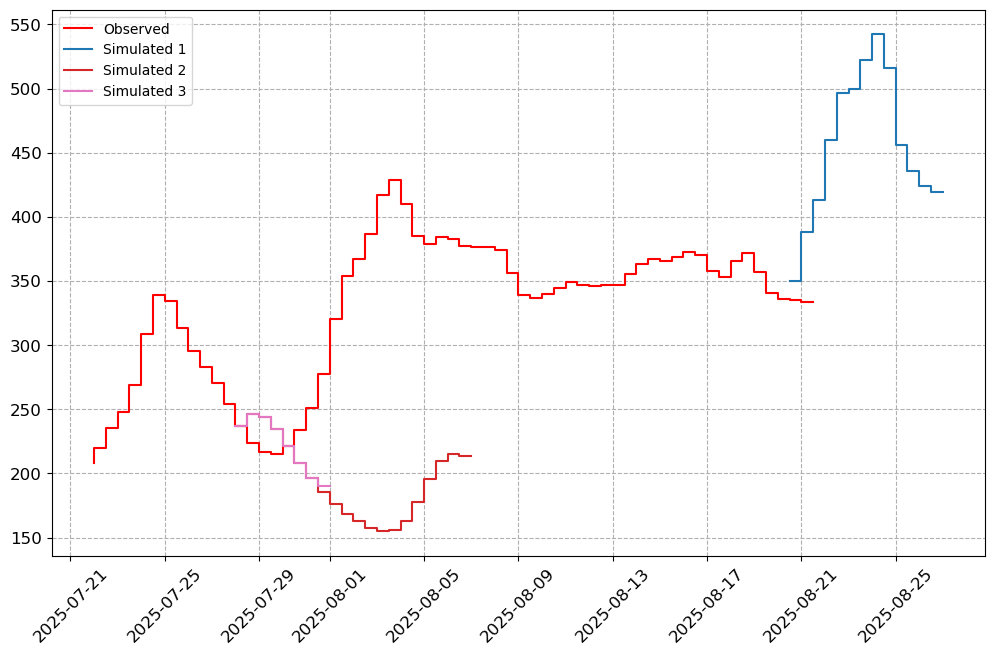
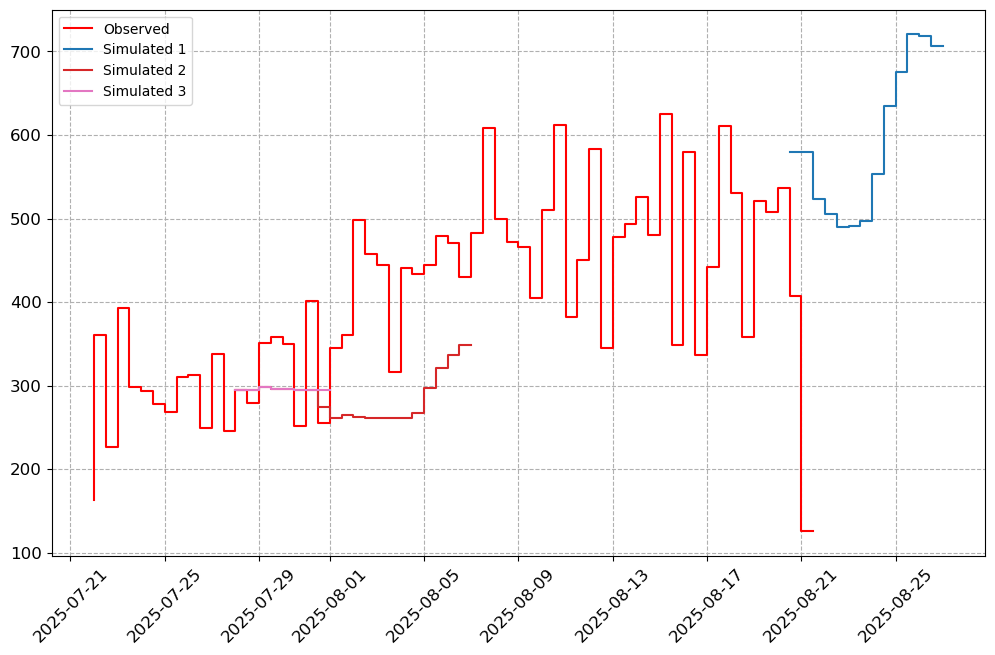
visuals.plot(merged_df = merged.loc[:, [col for col in stations_b if col in merged.columns]],
             step = True, grid = True)
Number of simulated data columns: 3
Number of linewidths provided is less than the number of columns. Number of columns : 4. Number of linewidths provided is:  1. Defaulting to 1.5
Number of linestyles provided is less than the number of columns. Number of columns : 4. Number of linestyles provided is:  1. Defaulting to solid lines (-)
Number of legends provided is less than the number of columns. Number of columns : 4. Number of legends provided is:  1. Applying Default legend names


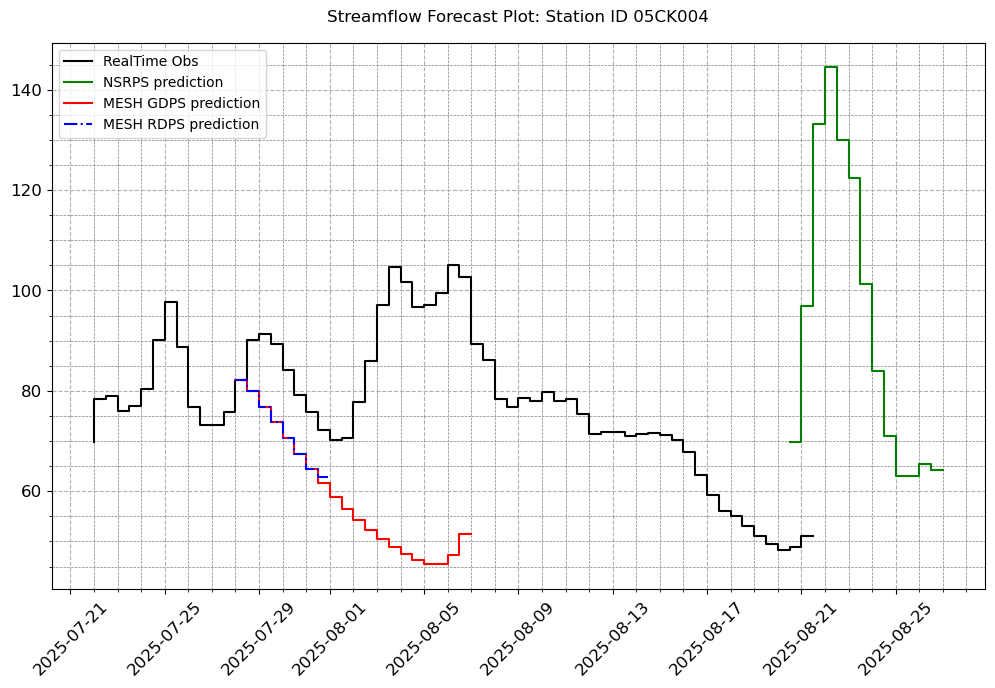
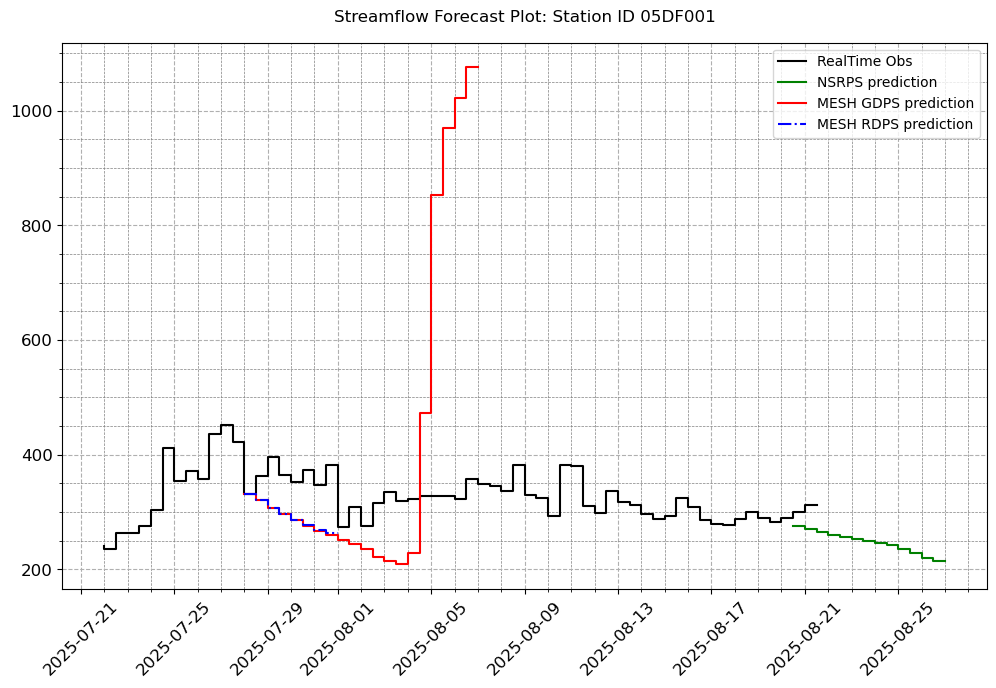
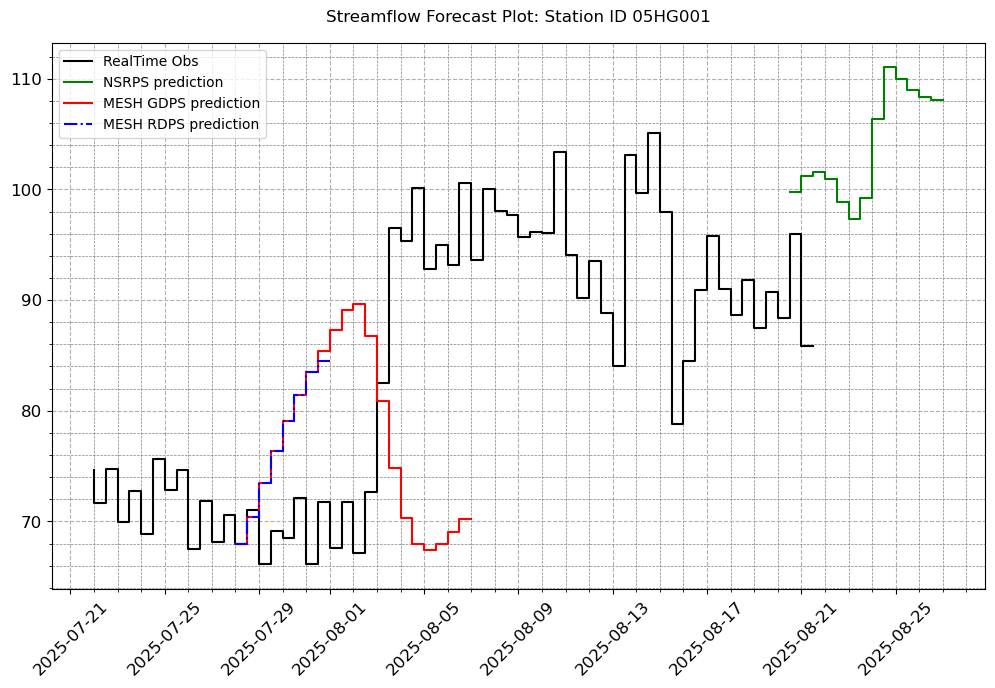
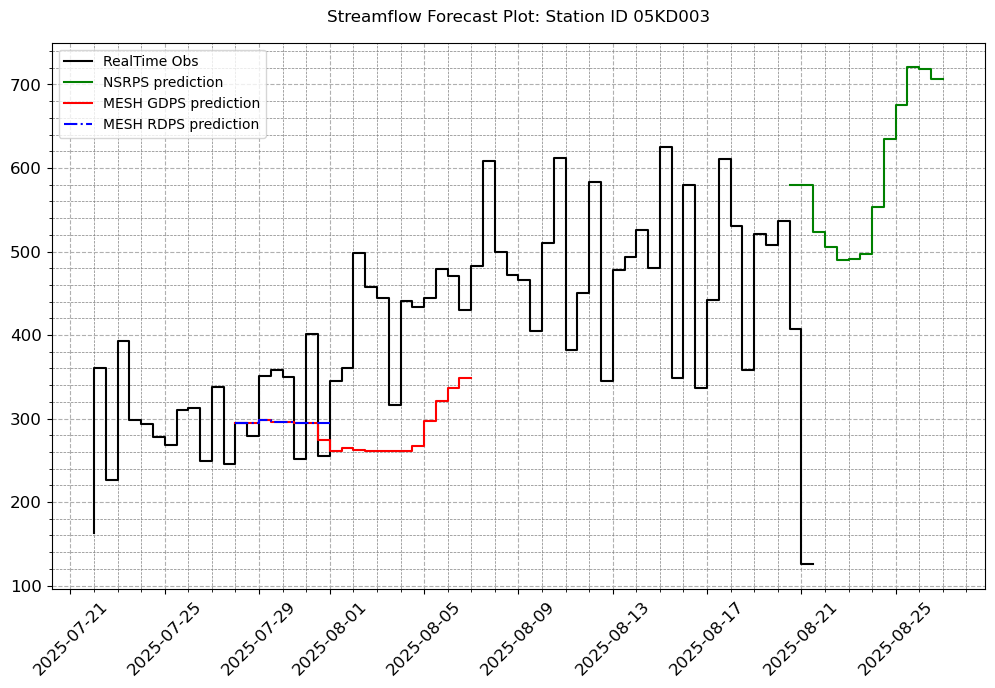
[8]:
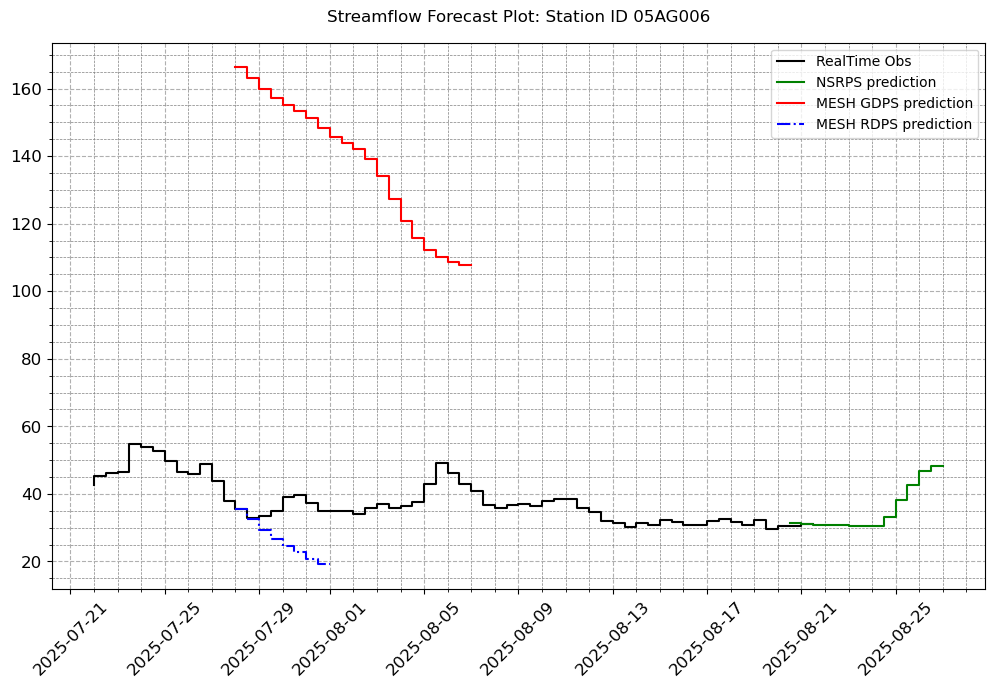
# Let us fill in the other plot features so that it looks exactly like we want.
visuals.plot(merged_df = merged.loc[:, [col for col in stations_a if col in merged.columns]],
             step = True, grid = True, legend = ["RealTime Obs", "NSRPS prediction", "MESH GDPS prediction","MESH RDPS prediction"],
             linestyles=('k-', 'g-','r-', 'b-.'), minor_grid=True,
             title = [f"Streamflow Forecast Plot: Station ID {i}" for i in stations_a],

            )
Number of simulated data columns: 3
Number of linewidths provided is less than the number of columns. Number of columns : 4. Number of linewidths provided is:  1. Defaulting to 1.5


[9]:
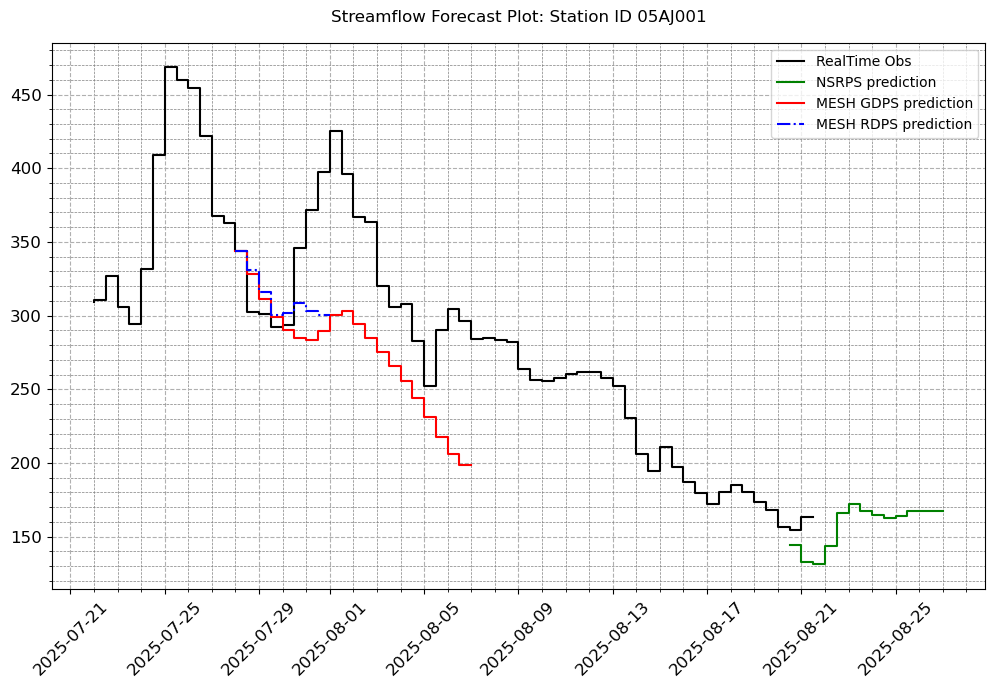
# Let us fill in the other plot features so that it looks exactly like we want.
visuals.plot(merged_df = merged.loc[:, [col for col in stations_b if col in merged.columns]],
             step = True, grid = True, legend = ["RealTime Obs", "NSRPS prediction", "MESH GDPS prediction","MESH RDPS prediction"],
             linestyles=('k-', 'g-','r-', 'b-.'), minor_grid=True,
             title = [f"Streamflow Forecast Plot: Station ID {i}" for i in stations_b]
            )
Number of simulated data columns: 3
Number of linewidths provided is less than the number of columns. Number of columns : 4. Number of linewidths provided is:  1. Defaulting to 1.5
[10]:
print("lt_median:\n",lt["lt_median"])
print("lt_Q75:\n",lt["lt_q75"])
print("lt_Q5:\n",lt["lt_q25"])
lt_median:
       05AA024  05AC003    05AD007    05AG006    05AJ001  05BB001  05BG010  \
jday
1        8.33   0.6260  17.500000  20.000000  75.500000    9.520    2.580
2        8.35   0.7600  18.000000  20.000000  75.099998    9.570    2.535
3        8.45   0.7800  17.299999  19.600000  73.699997    9.680    2.540
4        8.31   0.8000  18.500000  20.600000  67.300003    9.660    2.540
5        8.62   0.6360  18.900000  20.299999  67.000000    9.660    2.505
...       ...      ...        ...        ...        ...      ...      ...
362      8.25   0.7000  18.450000  18.750000  72.250000    9.870    2.640
363      8.25   0.6900  17.500000  19.250000  72.900002    9.640    2.630
364      8.27   0.6700  17.750000  19.549999  75.700001    9.390    2.610
365      8.25   0.6500  17.900001  19.250000  76.599998    9.615    2.610
366      8.10   0.6595  17.500000  17.500000  68.300003   10.100    2.630

        05BH004  05BL024    05BN012  ...     05DC001  05DF001     05EF001  \
jday                                 ...
1     48.000000    2.510  51.799999  ...  109.500000    109.5  110.500000
2     46.400002    2.490  51.500000  ...   90.199997    109.0  110.500000
3     47.099998    2.445  50.500000  ...  110.000000    108.0  111.500000
4     48.000000    2.480  50.400002  ...   99.599998    105.0  112.500000
5     50.000000    2.390  48.900002  ...  106.000000    105.5  114.000000
...         ...      ...        ...  ...         ...      ...         ...
362   51.250000    2.745  50.050001  ...  113.500000    112.0  118.000000
363   51.299999    2.710  51.000000  ...  116.000000    109.5  115.000000
364   50.799999    2.605  51.250000  ...  116.500000    107.0  112.000000
365   49.299999    2.520  51.000000  ...  115.000000    109.0  110.000000
366   49.000000    2.400  49.000000  ...         NaN    102.0   98.300003

      05FA001  05FE004  05GG001  05HD039  05HG001  05KD003  05KJ001
jday
1      0.1870   0.9110    125.0   0.4640    244.0    249.0    300.0
2      0.1850   0.8500    127.0   0.4700    236.0    315.0    299.0
3      0.1765   0.8150    126.0   0.4545    217.0    371.0    319.0
4      0.1770   0.7960    124.5   0.3725    238.0    384.0    319.0
5      0.1870   0.7950    120.5   0.4195    247.0    405.0    317.0
...       ...      ...      ...      ...      ...      ...      ...
362    0.1855   0.8955    129.0   0.4780    225.0    295.0    326.0
363    0.1895   0.9060    128.0   0.4780    229.0    319.5    304.5
364    0.1870   0.9235    130.5   0.4850    223.0    290.5    297.5
365    0.1680   0.9350    129.5   0.4750    235.0    277.5    296.5
366    0.2100   0.7540    119.0   0.5430    244.0    211.0    287.0

[366 rows x 26 columns]
lt_Q75:
       05AA024  05AC003    05AD007    05AG006    05AJ001  05BB001  05BG010  \
jday
1      10.500   1.2500  24.600000  25.500000  82.900002   10.400   2.8025
2      10.850   1.2300  22.799999  25.500000  82.900002   10.500   2.7750
3      10.800   1.2000  21.100000  26.200001  79.699997   10.800   2.7450
4      10.750   1.2500  21.000000  27.200001  80.000000   10.800   2.7225
5      10.650   1.2125  21.400000  25.200001  82.800003   11.200   2.7150
...       ...      ...        ...        ...        ...      ...      ...
362    10.900   1.1100  23.925000  28.100000  82.599998   11.225   2.8800
363    10.950   1.1500  24.475000  27.725000  85.600000   11.100   2.8600
364    10.900   1.2600  24.775000  28.650000  88.599998   10.825   2.8300
365    10.650   1.2500  24.900001  28.450000  87.725000   10.550   2.8200
366     9.655   1.0075  24.700000  24.275000  78.250000   11.350   2.7250

        05BH004  05BL024    05BN012  ...     05DC001  05DF001  05EF001  \
jday                                 ...
1     54.000000   3.2500  59.400002  ...  110.750000   123.25   133.00
2     55.700001   3.2850  61.000000  ...   90.199997   123.25   130.25
3     55.500000   3.3650  62.500000  ...  110.000000   118.25   124.25
4     58.000000   3.3925  64.000000  ...   99.599998   118.25   125.25
5     55.599998   3.3325  64.000000  ...  106.000000   126.00   128.00
...         ...      ...        ...  ...         ...      ...      ...
362   56.474999   3.5000  60.574999  ...  114.750000   124.75   138.50
363   57.849999   3.2925  59.074999  ...  117.000000   127.75   136.50
364   55.325000   3.4325  58.925001  ...  118.250000   128.50   136.00
365   56.125000   3.3100  60.699999  ...  116.500000   128.25   132.00
366   57.099998   3.1450  54.500000  ...         NaN   115.50   115.00

      05FA001  05FE004  05GG001  05HD039  05HG001  05KD003  05KJ001
jday
1     0.32925   1.2600   145.75  0.67525    268.0    346.0   386.00
2     0.32150   1.2600   139.25  0.66100    262.0    415.0   384.00
3     0.32700   1.2600   137.25  0.65275    258.5    441.0   384.00
4     0.32425   1.2600   143.00  0.59500    272.0    441.0   384.00
5     0.30950   1.2500   141.25  0.61000    281.0    454.0   384.00
...       ...      ...      ...      ...      ...      ...      ...
362   0.33225   1.2950   147.25  0.77000    249.5    333.5   398.75
363   0.32725   1.2875   149.00  0.62975    250.0    365.0   398.25
364   0.32775   1.2700   144.00  0.72350    255.0    373.5   394.75
365   0.32050   1.2425   143.50  0.77300    264.0    385.0   385.75
366   0.26350   1.1650   134.00  0.80600    279.5    413.0   389.00

[366 rows x 26 columns]
lt_Q5:
       05AA024  05AC003  05AD007  05AG006    05AJ001  05BB001  05BG010  \
jday
1       6.875  0.45000   12.600   15.200  57.400002   8.7600   2.1275
2       6.905  0.46000   12.800   16.000  58.000000   8.9800   2.1275
3       6.905  0.40500   13.000   15.600  51.900002   8.8900   2.1500
4       7.100  0.42600   12.700   15.500  53.900002   8.9100   2.1450
5       7.345  0.41200   13.400   15.300  55.000000   8.8200   2.1400
...       ...      ...      ...      ...        ...      ...      ...
362     7.060  0.41000   13.700   13.550  57.275000   8.8275   2.2700
363     6.970  0.42500   14.075   14.600  58.150001   8.7400   2.2600
364     6.865  0.45000   13.675   14.575  59.000001   8.9000   2.2200
365     6.950  0.42000   13.325   14.625  55.550000   8.6325   2.1700
366     6.830  0.38075   15.800   14.700  56.650000   9.3350   2.3675

        05BH004  05BL024    05BN012  ...     05DC001     05DF001     05EF001  \
jday                                 ...
1     42.400002   1.8625  37.000000  ...  108.250000   91.825001   89.000000
2     43.599998   1.8375  39.000000  ...   90.199997   91.175003   88.500000
3     44.000000   1.7900  39.099998  ...  110.000000   89.650002   91.750000
4     44.099998   1.7450  39.599998  ...   99.599998   89.900000   89.599998
5     42.000000   1.6950  40.000000  ...  106.000000   90.049999   91.649998
...         ...      ...        ...  ...         ...         ...         ...
362   42.050000   1.9300  38.675001  ...  112.250000   98.600002  100.500000
363   41.800000   2.1375  39.399999  ...  115.000000   90.074999   94.350002
364   43.775000   2.0300  39.024999  ...  114.750000   90.000000   93.200001
365   43.124999   1.9000  39.024999  ...  113.500000   94.175003   94.949997
366   42.500000   1.7150  31.500000  ...         NaN  100.000000   92.099998

      05FA001  05FE004     05GG001  05HD039  05HG001  05KD003  05KJ001
jday
1     0.11250  0.58900  102.500000  0.18700    214.0    202.0   241.00
2     0.11425  0.56000  101.750000  0.19675    209.0    233.0   234.00
3     0.11800  0.54700  102.000000  0.19675    198.0    268.0   233.00
4     0.11450  0.49700  105.750000  0.19325    211.5    340.0   235.00
5     0.11900  0.51000  105.150000  0.20675    208.0    331.0   237.00
...       ...      ...         ...      ...      ...      ...      ...
362   0.11975  0.60150  106.000000  0.21575    195.5    235.0   262.75
363   0.11250  0.62000  107.250000  0.20175    203.0    221.0   249.00
364   0.10750  0.60775  107.000000  0.20700    204.5    217.5   235.75
365   0.10725  0.58725  103.750000  0.20125    209.5    196.0   242.25
366   0.16850  0.61200   95.200001  0.17950    195.5    182.0   246.50

[366 rows x 26 columns]
Observe that the indexes of the aggregations are integers from 1-366 and the Real-Time and NSRPS have datetime index. We have to convert the jday indexes to UTC datetime and then extract that 37 day time frame before we can plot the data. To do that, we use the prepare_historical_dataframes() functions
[11]:
median, upper, lower = forecast.prepare_historical_dataframes(merged, lt["lt_median"],[lt["lt_q95"],lt["lt_q75"]], [lt["lt_q5"],lt["lt_q25"]])
# Recall - merged is the 37 day data that we are trying to compare to
# this should extract the corresponding 37 days with UTC datetime index.
[12]:
print("median:\n",lt["lt_median"])
median:
       05AA024  05AC003    05AD007    05AG006    05AJ001  05BB001  05BG010  \
jday
1        8.33   0.6260  17.500000  20.000000  75.500000    9.520    2.580
2        8.35   0.7600  18.000000  20.000000  75.099998    9.570    2.535
3        8.45   0.7800  17.299999  19.600000  73.699997    9.680    2.540
4        8.31   0.8000  18.500000  20.600000  67.300003    9.660    2.540
5        8.62   0.6360  18.900000  20.299999  67.000000    9.660    2.505
...       ...      ...        ...        ...        ...      ...      ...
362      8.25   0.7000  18.450000  18.750000  72.250000    9.870    2.640
363      8.25   0.6900  17.500000  19.250000  72.900002    9.640    2.630
364      8.27   0.6700  17.750000  19.549999  75.700001    9.390    2.610
365      8.25   0.6500  17.900001  19.250000  76.599998    9.615    2.610
366      8.10   0.6595  17.500000  17.500000  68.300003   10.100    2.630

        05BH004  05BL024    05BN012  ...     05DC001  05DF001     05EF001  \
jday                                 ...
1     48.000000    2.510  51.799999  ...  109.500000    109.5  110.500000
2     46.400002    2.490  51.500000  ...   90.199997    109.0  110.500000
3     47.099998    2.445  50.500000  ...  110.000000    108.0  111.500000
4     48.000000    2.480  50.400002  ...   99.599998    105.0  112.500000
5     50.000000    2.390  48.900002  ...  106.000000    105.5  114.000000
...         ...      ...        ...  ...         ...      ...         ...
362   51.250000    2.745  50.050001  ...  113.500000    112.0  118.000000
363   51.299999    2.710  51.000000  ...  116.000000    109.5  115.000000
364   50.799999    2.605  51.250000  ...  116.500000    107.0  112.000000
365   49.299999    2.520  51.000000  ...  115.000000    109.0  110.000000
366   49.000000    2.400  49.000000  ...         NaN    102.0   98.300003

      05FA001  05FE004  05GG001  05HD039  05HG001  05KD003  05KJ001
jday
1      0.1870   0.9110    125.0   0.4640    244.0    249.0    300.0
2      0.1850   0.8500    127.0   0.4700    236.0    315.0    299.0
3      0.1765   0.8150    126.0   0.4545    217.0    371.0    319.0
4      0.1770   0.7960    124.5   0.3725    238.0    384.0    319.0
5      0.1870   0.7950    120.5   0.4195    247.0    405.0    317.0
...       ...      ...      ...      ...      ...      ...      ...
362    0.1855   0.8955    129.0   0.4780    225.0    295.0    326.0
363    0.1895   0.9060    128.0   0.4780    229.0    319.5    304.5
364    0.1870   0.9235    130.5   0.4850    223.0    290.5    297.5
365    0.1680   0.9350    129.5   0.4750    235.0    277.5    296.5
366    0.2100   0.7540    119.0   0.5430    244.0    211.0    287.0

[366 rows x 26 columns]
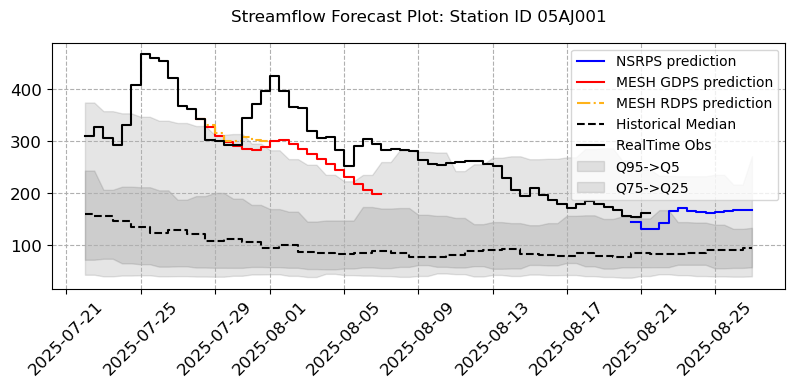
[13]:
# Now we plot
visuals.bounded_plot(lines=merged.loc[:, [(s, "QOMEAS") for s in stations_a if (s, "QOMEAS") in merged.columns]],
                     upper_bounds=[df.loc[:, [col for col in stations_a if col in df.columns]] for df in upper],
                     lower_bounds=[df.loc[:, [col for col in stations_a if col in df.columns]] for df in lower],
                     extra_lines=[merged.loc[:, [(s, "QOSIM1") for s in stations_a if (s, "QOSIM1") in merged.columns]],
                                  merged.loc[:, [(s, "QOSIM2") for s in stations_a if (s, "QOSIM2") in merged.columns]],
                                  merged.loc[:, [(s, "QOSIM3") for s in stations_a if (s, "QOSIM3") in merged.columns]],
                                  median.loc[:, [col for col in stations_a if col in median.columns]]
                                 ],
                     grid = True, step = True, legend = ["NSRPS prediction","MESH GDPS prediction","MESH RDPS prediction", "Historical Median", "RealTime Obs"], bound_legend= ["Q95->Q5","Q75->Q25"],
                     linestyles=("b-", "r-", "(1.00, 0.70, 0.10)-.", "k--", "(0.00, 0.00, 0.00)solid"), transparency = [0.1], title = [f"Streamflow Forecast Plot: Station ID {i}" for i in stations_a],
                     fig_size = (8, 3)
                    )
Number of linewidths provided is less than the number of lines to plot. Number of lines : 5. Number of linewidths provided is: 1. Defaulting to 1.5


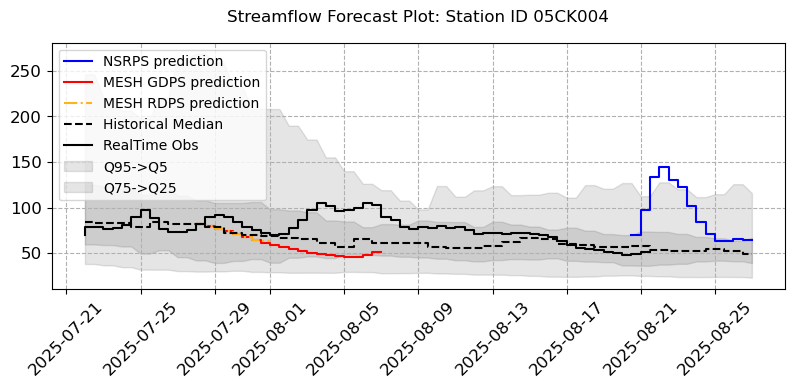
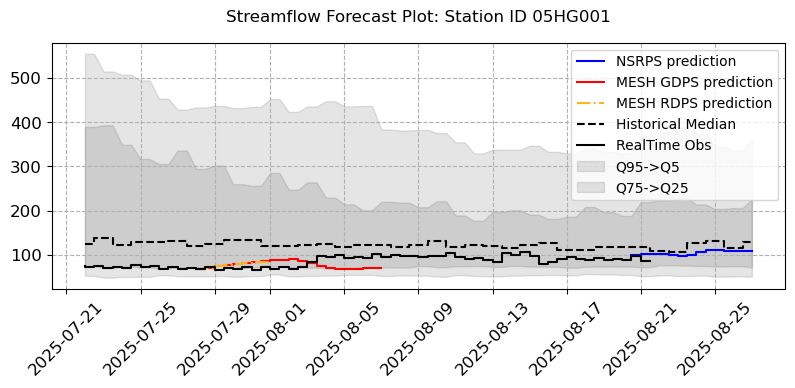
[14]:
# Now we plot
# Now we plot
visuals.bounded_plot(lines=merged.loc[:, [(s, "QOMEAS") for s in stations_b if (s, "QOMEAS") in merged.columns]],
                     upper_bounds=[df.loc[:, [col for col in stations_b if col in df.columns]] for df in upper],
                     lower_bounds=[df.loc[:, [col for col in stations_b if col in df.columns]] for df in lower],
                     extra_lines=[merged.loc[:, [(s, "QOSIM1") for s in stations_b if (s, "QOSIM1") in merged.columns]],
                                  merged.loc[:, [(s, "QOSIM2") for s in stations_b if (s, "QOSIM2") in merged.columns]],
                                  merged.loc[:, [(s, "QOSIM3") for s in stations_b if (s, "QOSIM3") in merged.columns]],
                                  median.loc[:, [col for col in stations_b if col in median.columns]]
                                 ],
                     grid = True, step = True, legend = ["NSRPS prediction","MESH GDPS prediction","MESH RDPS prediction", "Historical Median", "RealTime Obs"], bound_legend= ["Q95->Q5","Q75->Q25"],
                     linestyles=("b-", "r-", "(1.00, 0.70, 0.10)-.", "k--", "(0.00, 0.00, 0.00)solid"), transparency = [0.1], title = [f"Streamflow Forecast Plot: Station ID {i}" for i in stations_b],
#                      linewidth =(1.5,2, 1.5, 1.5, 1.5),
                     fig_size = (8, 3)
                    )
Number of linewidths provided is less than the number of lines to plot. Number of lines : 5. Number of linewidths provided is: 1. Defaulting to 1.5


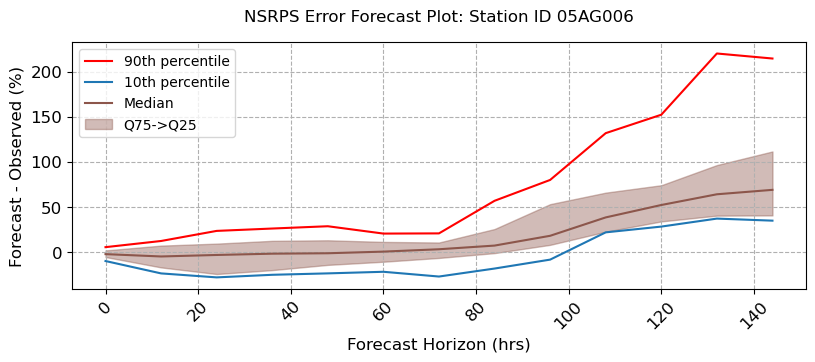
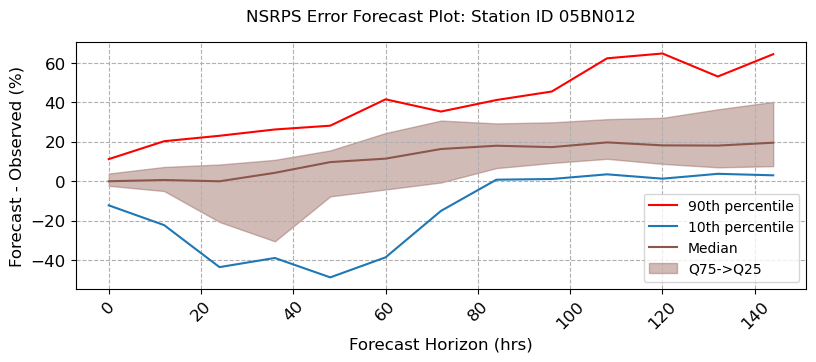
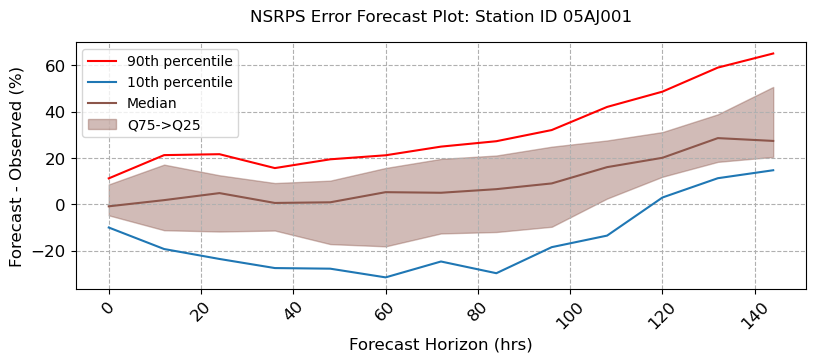
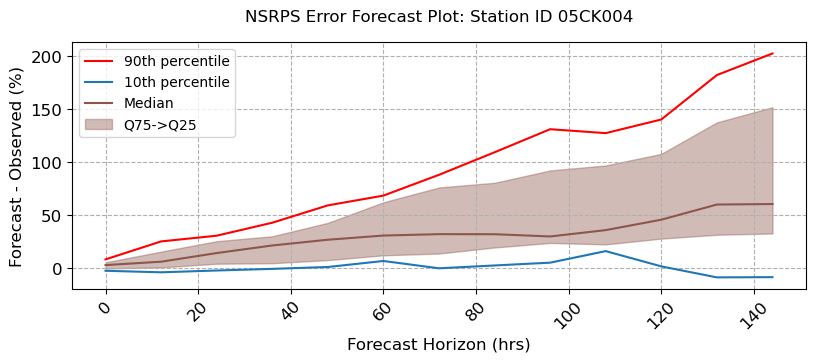
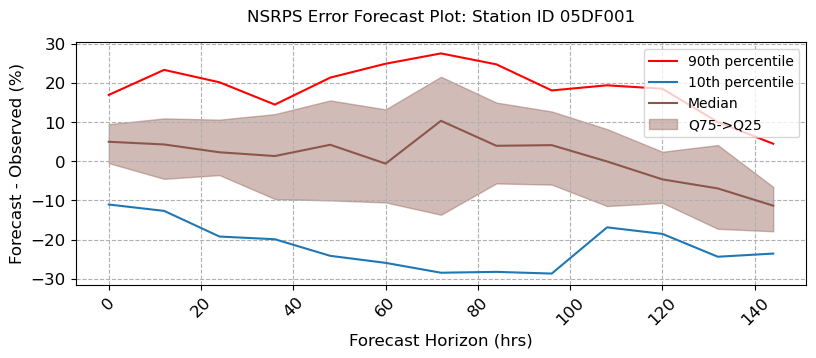
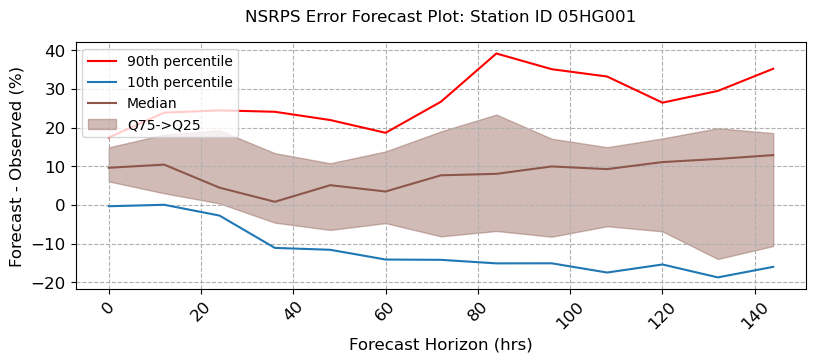
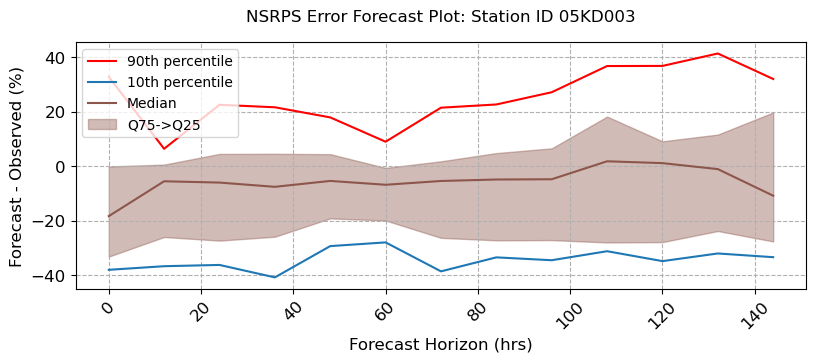
Forecast Error
Using multiple days of saved observed and forecasted streamflow data we want to generate the rate of forecast error. That is we want to determine how accurate the forecast is when compared to the actual predicted value for that day.
Lets calculate the error from the NSRPS predictions
NSRPS Forecast Error Calculations
[15]:
from pathlib import Path

# Directory containing the CSV files
dir_path = Path("../../../postprocessinglib/forecast/NSRPS_PRED")

# Find and sort all files starting with "merged" and ending with ".csv"
merged_files = sorted(dir_path.glob("merged*.csv"))

# Create a dictionary with keys as csv_1, csv_2, ...
DATA = {}
for i, file in enumerate(merged_files, start=1):
    df = pd.read_csv(file, header=[0, 1], index_col=0, parse_dates=True)
    df.columns = [f"{label}_{station}" for station, label in df.columns]
    df = df.drop(columns=[col for col in df.columns if col.startswith('QOMEAS_')])
    DATA[f"csv_{i}"] = df

DATA.keys()
[15]:
dict_keys(['csv_1', 'csv_2', 'csv_3', 'csv_4', 'csv_5', 'csv_6', 'csv_7', 'csv_8', 'csv_9', 'csv_10', 'csv_11', 'csv_12', 'csv_13', 'csv_14', 'csv_15', 'csv_16', 'csv_17', 'csv_18', 'csv_19', 'csv_20', 'csv_21', 'csv_22', 'csv_23', 'csv_24', 'csv_25', 'csv_26', 'csv_27', 'csv_28', 'csv_29', 'csv_30', 'csv_31', 'csv_32', 'csv_33', 'csv_34', 'csv_35', 'csv_36', 'csv_37', 'csv_38', 'csv_39', 'csv_40', 'csv_41', 'csv_42', 'csv_43', 'csv_44', 'csv_45'])
[16]:
df_stats = forecast.forecast_error_calculation(
    files=list(DATA.values()),
    stats= ['q10', 'q25', 'q50', 'q75', 'q90' ]
)
Window 2025-07-21–2025-07-22 in 4.3s
Window 2025-07-22–2025-07-23 in 4.6s
Window 2025-07-23–2025-07-24 in 4.8s
Window 2025-07-24–2025-07-25 in 4.6s
Window 2025-07-25–2025-07-26 in 4.6s
Window 2025-07-26–2025-07-27 in 4.5s
Window 2025-07-27–2025-07-28 in 4.5s
Window 2025-07-28–2025-07-29 in 4.7s
Window 2025-07-29–2025-07-30 in 4.7s
Window 2025-07-30–2025-07-31 in 4.7s
Window 2025-07-31–2025-08-01 in 4.5s
Window 2025-08-01–2025-08-02 in 4.5s
Window 2025-08-02–2025-08-03 in 4.5s
Window 2025-08-03–2025-08-04 in 4.7s
Window 2025-08-04–2025-08-05 in 4.7s
Window 2025-08-05–2025-08-06 in 4.6s
Window 2025-08-06–2025-08-07 in 4.8s
Window 2025-08-07–2025-08-08 in 4.6s
Window 2025-08-08–2025-08-09 in 4.8s
Window 2025-08-09–2025-08-10 in 4.5s
Window 2025-08-10–2025-08-11 in 4.7s
Window 2025-08-11–2025-08-12 in 4.6s
Window 2025-08-12–2025-08-13 in 4.7s
Window 2025-08-13–2025-08-14 in 4.5s
Window 2025-08-14–2025-08-15 in 4.8s
Window 2025-08-15–2025-08-16 in 4.5s
Window 2025-08-16–2025-08-17 in 5.4s
Window 2025-08-17–2025-08-18 in 4.6s
Window 2025-08-18–2025-08-19 in 4.9s
Window 2025-08-19–2025-08-20 in 4.6s
Window 2025-08-20–2025-08-21 in 4.7s
C:\Users\udenzeU\AppData\Local\anaconda3\envs\postprocessing\Lib\site-packages\GeneralProcessing\gen_streamflow_file.py:420: FutureWarning: 'H' is deprecated and will be removed in a future version, please use 'h' instead.
  .resample(f"{freq_hours}H")
C:\Users\udenzeU\AppData\Local\anaconda3\envs\postprocessing\Lib\site-packages\GeneralProcessing\gen_streamflow_file.py:420: FutureWarning: 'H' is deprecated and will be removed in a future version, please use 'h' instead.
  .resample(f"{freq_hours}H")
C:\Users\udenzeU\AppData\Local\anaconda3\envs\postprocessing\Lib\site-packages\GeneralProcessing\gen_streamflow_file.py:420: FutureWarning: 'H' is deprecated and will be removed in a future version, please use 'h' instead.
  .resample(f"{freq_hours}H")
C:\Users\udenzeU\AppData\Local\anaconda3\envs\postprocessing\Lib\site-packages\GeneralProcessing\gen_streamflow_file.py:420: FutureWarning: 'H' is deprecated and will be removed in a future version, please use 'h' instead.
  .resample(f"{freq_hours}H")
C:\Users\udenzeU\AppData\Local\anaconda3\envs\postprocessing\Lib\site-packages\GeneralProcessing\gen_streamflow_file.py:420: FutureWarning: 'H' is deprecated and will be removed in a future version, please use 'h' instead.
  .resample(f"{freq_hours}H")
C:\Users\udenzeU\AppData\Local\anaconda3\envs\postprocessing\Lib\site-packages\GeneralProcessing\gen_streamflow_file.py:420: FutureWarning: 'H' is deprecated and will be removed in a future version, please use 'h' instead.
  .resample(f"{freq_hours}H")
C:\Users\udenzeU\AppData\Local\anaconda3\envs\postprocessing\Lib\site-packages\GeneralProcessing\gen_streamflow_file.py:420: FutureWarning: 'H' is deprecated and will be removed in a future version, please use 'h' instead.
  .resample(f"{freq_hours}H")
C:\Users\udenzeU\AppData\Local\anaconda3\envs\postprocessing\Lib\site-packages\GeneralProcessing\gen_streamflow_file.py:420: FutureWarning: 'H' is deprecated and will be removed in a future version, please use 'h' instead.
  .resample(f"{freq_hours}H")
C:\Users\udenzeU\AppData\Local\anaconda3\envs\postprocessing\Lib\site-packages\GeneralProcessing\gen_streamflow_file.py:420: FutureWarning: 'H' is deprecated and will be removed in a future version, please use 'h' instead.
  .resample(f"{freq_hours}H")
C:\Users\udenzeU\AppData\Local\anaconda3\envs\postprocessing\Lib\site-packages\GeneralProcessing\gen_streamflow_file.py:420: FutureWarning: 'H' is deprecated and will be removed in a future version, please use 'h' instead.
  .resample(f"{freq_hours}H")
C:\Users\udenzeU\AppData\Local\anaconda3\envs\postprocessing\Lib\site-packages\GeneralProcessing\gen_streamflow_file.py:420: FutureWarning: 'H' is deprecated and will be removed in a future version, please use 'h' instead.
  .resample(f"{freq_hours}H")
C:\Users\udenzeU\AppData\Local\anaconda3\envs\postprocessing\Lib\site-packages\GeneralProcessing\gen_streamflow_file.py:420: FutureWarning: 'H' is deprecated and will be removed in a future version, please use 'h' instead.
  .resample(f"{freq_hours}H")
C:\Users\udenzeU\AppData\Local\anaconda3\envs\postprocessing\Lib\site-packages\GeneralProcessing\gen_streamflow_file.py:420: FutureWarning: 'H' is deprecated and will be removed in a future version, please use 'h' instead.
  .resample(f"{freq_hours}H")
C:\Users\udenzeU\AppData\Local\anaconda3\envs\postprocessing\Lib\site-packages\GeneralProcessing\gen_streamflow_file.py:420: FutureWarning: 'H' is deprecated and will be removed in a future version, please use 'h' instead.
  .resample(f"{freq_hours}H")
C:\Users\udenzeU\AppData\Local\anaconda3\envs\postprocessing\Lib\site-packages\GeneralProcessing\gen_streamflow_file.py:420: FutureWarning: 'H' is deprecated and will be removed in a future version, please use 'h' instead.
  .resample(f"{freq_hours}H")
C:\Users\udenzeU\AppData\Local\anaconda3\envs\postprocessing\Lib\site-packages\GeneralProcessing\gen_streamflow_file.py:420: FutureWarning: 'H' is deprecated and will be removed in a future version, please use 'h' instead.
  .resample(f"{freq_hours}H")
C:\Users\udenzeU\AppData\Local\anaconda3\envs\postprocessing\Lib\site-packages\GeneralProcessing\gen_streamflow_file.py:420: FutureWarning: 'H' is deprecated and will be removed in a future version, please use 'h' instead.
  .resample(f"{freq_hours}H")
C:\Users\udenzeU\AppData\Local\anaconda3\envs\postprocessing\Lib\site-packages\GeneralProcessing\gen_streamflow_file.py:420: FutureWarning: 'H' is deprecated and will be removed in a future version, please use 'h' instead.
  .resample(f"{freq_hours}H")
C:\Users\udenzeU\AppData\Local\anaconda3\envs\postprocessing\Lib\site-packages\GeneralProcessing\gen_streamflow_file.py:420: FutureWarning: 'H' is deprecated and will be removed in a future version, please use 'h' instead.
  .resample(f"{freq_hours}H")
C:\Users\udenzeU\AppData\Local\anaconda3\envs\postprocessing\Lib\site-packages\GeneralProcessing\gen_streamflow_file.py:420: FutureWarning: 'H' is deprecated and will be removed in a future version, please use 'h' instead.
  .resample(f"{freq_hours}H")
C:\Users\udenzeU\AppData\Local\anaconda3\envs\postprocessing\Lib\site-packages\GeneralProcessing\gen_streamflow_file.py:420: FutureWarning: 'H' is deprecated and will be removed in a future version, please use 'h' instead.
  .resample(f"{freq_hours}H")
C:\Users\udenzeU\AppData\Local\anaconda3\envs\postprocessing\Lib\site-packages\GeneralProcessing\gen_streamflow_file.py:420: FutureWarning: 'H' is deprecated and will be removed in a future version, please use 'h' instead.
  .resample(f"{freq_hours}H")
C:\Users\udenzeU\AppData\Local\anaconda3\envs\postprocessing\Lib\site-packages\GeneralProcessing\gen_streamflow_file.py:420: FutureWarning: 'H' is deprecated and will be removed in a future version, please use 'h' instead.
  .resample(f"{freq_hours}H")
C:\Users\udenzeU\AppData\Local\anaconda3\envs\postprocessing\Lib\site-packages\GeneralProcessing\gen_streamflow_file.py:420: FutureWarning: 'H' is deprecated and will be removed in a future version, please use 'h' instead.
  .resample(f"{freq_hours}H")
C:\Users\udenzeU\AppData\Local\anaconda3\envs\postprocessing\Lib\site-packages\GeneralProcessing\gen_streamflow_file.py:420: FutureWarning: 'H' is deprecated and will be removed in a future version, please use 'h' instead.
  .resample(f"{freq_hours}H")
C:\Users\udenzeU\AppData\Local\anaconda3\envs\postprocessing\Lib\site-packages\GeneralProcessing\gen_streamflow_file.py:420: FutureWarning: 'H' is deprecated and will be removed in a future version, please use 'h' instead.
  .resample(f"{freq_hours}H")
⚠️ Skipping file/index 44 — no QOSIM columns.
⚠️ Skipping file/index 45 — no QOSIM columns.
[17]:
visuals.bounded_plot(
    lines = df_stats.loc[:, [(s, "Q50") for s in stations_a if (s, "Q50") in df_stats.columns]],
    upper_bounds = df_stats.loc[:, [(s, "Q75") for s in stations_a if (s, "Q75") in df_stats.columns]],
    lower_bounds = df_stats.loc[:, [(s, "Q25") for s in stations_a if (s, "Q25") in df_stats.columns]],
    extra_lines = [
        df_stats.loc[:, [(s, "Q90") for s in stations_a if (s, "Q90") in df_stats.columns]],
        df_stats.loc[:, [(s, "Q10") for s in stations_a if (s, "Q10") in df_stats.columns]]
    ],
    grid = True, legend = ["90th percentile", "10th percentile", "Median"],
    bound_legend= ["Q75->Q25"],
    labels = [ "Forecast Horizon (hrs)", "Forecast - Observed (%)",],
    title = [f"NSRPS Error Forecast Plot: Station ID {i}" for i in stations_a ],
    fig_size = (8, 3)
)
Number of linestyles provided is less than the minimum required. Number of Lines : 3. Number of linestyles provided is:  1. Defaulting to solid lines (-)
Number of linewidths provided is less than the number of lines to plot. Number of lines : 3. Number of linewidths provided is:  1. Defaulting to 1.5

[18]:
visuals.bounded_plot(
    lines = df_stats.loc[:, [(s, "Q50") for s in stations_b if (s, "Q50") in df_stats.columns]],
    upper_bounds = df_stats.loc[:, [(s, "Q75") for s in stations_b if (s, "Q75") in df_stats.columns]],
    lower_bounds = df_stats.loc[:, [(s, "Q25") for s in stations_b if (s, "Q25") in df_stats.columns]],
    extra_lines = [
        df_stats.loc[:, [(s, "Q90") for s in stations_b if (s, "Q90") in df_stats.columns]],
        df_stats.loc[:, [(s, "Q10") for s in stations_b if (s, "Q10") in df_stats.columns]]
    ],
    grid = True, legend = ["90th percentile", "10th percentile", "Median"],
    bound_legend= ["Q75->Q25"],
    labels = [ "Forecast Horizon (hrs)", "Forecast - Observed (%)",],
    title = [f"NSRPS Error Forecast Plot: Station ID {i}" for i in stations_b ],
    fig_size = (8, 3)
)
Number of linestyles provided is less than the minimum required. Number of Lines : 3. Number of linestyles provided is:  1. Defaulting to solid lines (-)
Number of linewidths provided is less than the number of lines to plot. Number of lines : 3. Number of linewidths provided is:  1. Defaulting to 1.5
MESH Forecast Error Calculations
[19]:
from pathlib import Path

base_path = Path(
    "C:/Users/udenzeU/OneDrive - EC-EC/Fuad_Mesh_Dataset/"
    "srb_prediction_system_multi_run/gem_forecasts/05KJ001"
)

dates = [f"202507{day:02d}18" for day in range(20, 30)]

merged_files = []

for date in dates:
    gdps_path = base_path / date / "GDPS"
    # Use glob to match RESULTS1 to RESULTS10 folders inside GDPS
    for result_folder in gdps_path.glob("RESULTS*"):
        file_path = result_folder / "MESH_output_streamflow_ts.csv"
        if file_path.exists():
            merged_files.append(file_path)
[ ]:
df_stats = forecast.forecast_error_calculation(
    files=merged_files,
    stats= ['q10', 'q25', 'q50', 'q75', 'q90' ]
)
Window 2025-07-21–2025-07-22 in 6.5s
Window 2025-07-22–2025-07-23 in 6.6s
Window 2025-07-23–2025-07-24 in 7.2s
Window 2025-07-24–2025-07-25 in 6.7s
Window 2025-07-25–2025-07-26 in 7.1s
Window 2025-07-26–2025-07-27 in 6.7s
Window 2025-07-27–2025-07-28 in 6.5s
Window 2025-07-28–2025-07-29 in 6.6s
Window 2025-07-29–2025-07-30 in 6.4s
Window 2025-07-30–2025-07-31 in 6.4s
Window 2025-07-31–2025-08-01 in 6.7s
Window 2025-08-01–2025-08-02 in 6.6s
Window 2025-08-02–2025-08-03 in 6.8s
Window 2025-08-03–2025-08-04 in 6.4s
Window 2025-08-04–2025-08-05 in 7.0s
Window 2025-08-05–2025-08-06 in 6.5s
Window 2025-08-06–2025-08-07 in 6.6s
Window 2025-08-07–2025-08-08 in 6.5s
Window 2025-08-08–2025-08-09 in 6.4s
Window 2025-08-09–2025-08-10 in 6.3s
[ ]:
visuals.bounded_plot(
    lines = df_stats.loc[:, [(s, "Q50") for s in stations_a if (s, "Q50") in df_stats.columns]],
    upper_bounds = df_stats.loc[:, [(s, "Q75") for s in stations_a if (s, "Q75") in df_stats.columns]],
    lower_bounds = df_stats.loc[:, [(s, "Q25") for s in stations_a if (s, "Q25") in df_stats.columns]],
    extra_lines = [
        df_stats.loc[:, [(s, "Q90") for s in stations_a if (s, "Q90") in df_stats.columns]],
        df_stats.loc[:, [(s, "Q10") for s in stations_a if (s, "Q10") in df_stats.columns]]
    ],
    grid = True, legend = ["90th percentile", "10th percentile", "Median"],
    bound_legend= ["Q75->Q25"],
    labels = [ "Forecast Horizon (hrs)", "Forecast - Observed (%)",],
    title = [f"MESH Error Forecast Plot: Station ID {i}" for i in stations_a ],
    fig_size = (8, 3)
)
[ ]:
visuals.bounded_plot(
    lines = df_stats.loc[:, [(s, "Q50") for s in stations_b if (s, "Q50") in df_stats.columns]],
    upper_bounds = df_stats.loc[:, [(s, "Q75") for s in stations_b if (s, "Q75") in df_stats.columns]],
    lower_bounds = df_stats.loc[:, [(s, "Q25") for s in stations_b if (s, "Q25") in df_stats.columns]],
    extra_lines = [
        df_stats.loc[:, [(s, "Q90") for s in stations_b if (s, "Q90") in df_stats.columns]],
        df_stats.loc[:, [(s, "Q10") for s in stations_b if (s, "Q10") in df_stats.columns]]
    ],
    grid = True, legend = ["90th percentile", "10th percentile", "Median"],
    bound_legend= ["Q75->Q25"],
    labels = [ "Forecast Horizon (hrs)", "Forecast - Observed (%)",],
    title = [f"MESH Error Forecast Plot: Station ID {i}" for i in stations_b ],
    fig_size = (8, 3)
)
[ ]:
[ ]:
[ ]:
[ ]: